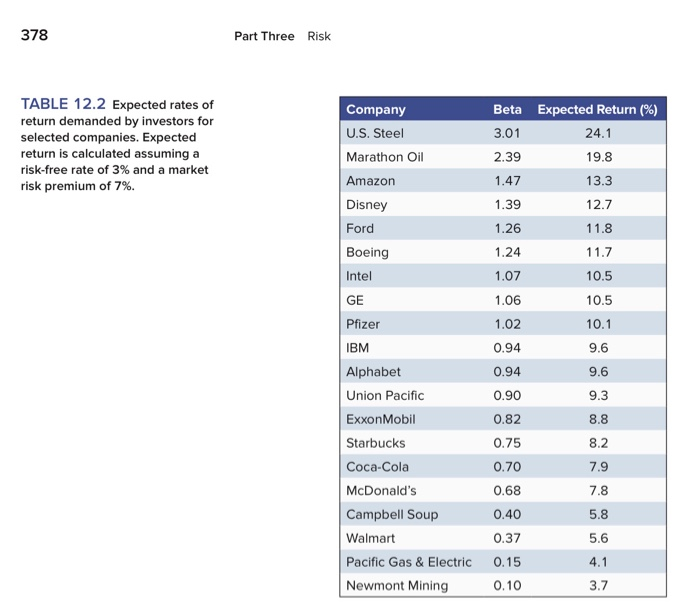
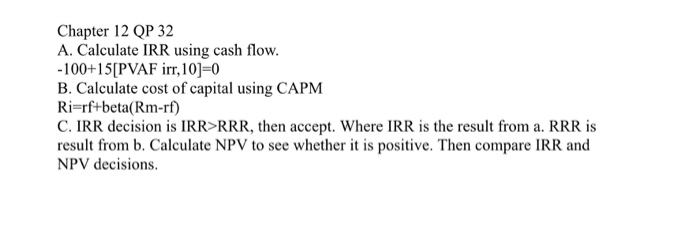
The thrid picture is a hint and how to solve the problem
378 Part Three Risk TABLE 12.2 Expected rates of return demanded by investors for selected companies. Expected return is calculated assuming a risk-free rate of 3% and a market risk premium of 7%. Company U.S. Steel Marathon Oil Beta 3.01 2.39 1.47 Expected Return (%) 24.1 19.8 13.3 12.7 Amazon Disney 1.39 Ford 11.8 Boeing Intel GE Pfizer IBM Alphabet Union Pacific ExxonMobil Starbucks Coca-Cola McDonald's Campbell Soup Walmart Pacific Gas & Electric Newmont Mining 1.26 1.24 1.07 1.06 1.02 0.94 0.94 0.90 0.82 0.75 0.70 0.68 0.40 0.37 0.15 0.10 11.7 10.5 10.5 10.1 9.6 9.6 9.3 8.8 8.2 7.9 7.8 5.8 5.6 4.1 3.7 13. CAPM and Expected Return. Suppose that the Treasury bill rate is 6% rather than the 3% value assumed in Table 12.2. Use the betas in Table 12.2 to answer the following questions. (L012-2) a. How does this change your estimate of the rate of return on the market portfolio? b. Using your answer to part (a), calculate the expected return on the stocks in Table 12.2. c. Suppose now that you continued to assume that the expected return on the market remained at 10%. Now what would be the expected return on each stock? d. Compare your expected returns in part (c) to those in Table 12.2. Which stocks have a higher expected return? Which lower? If you neglect to adjust the forecast of the market return to the change in the risk-free rate, how are your estimates of expected return likely to be biased? e. Would Walmart offer a higher or lower expected return if the interest rate were 6% rather than 3%? Assume that the expected rate of return on the market remains at 10%. Chapter 12 QP 32 A. Calculate IRR using cash flow. -100+15[PVAF irr, 10)=0 B. Calculate cost of capital using CAPM Ri=rf+beta(Rm-rf) C. IRR decision is IRRRRR, then accept. Where IRR is the result from a. RRR is result from b. Calculate NPV to see whether it is positive. Then compare IRR and NPV decisions