

Answered step by step
Verified Expert Solution
Question
1 Approved Answer
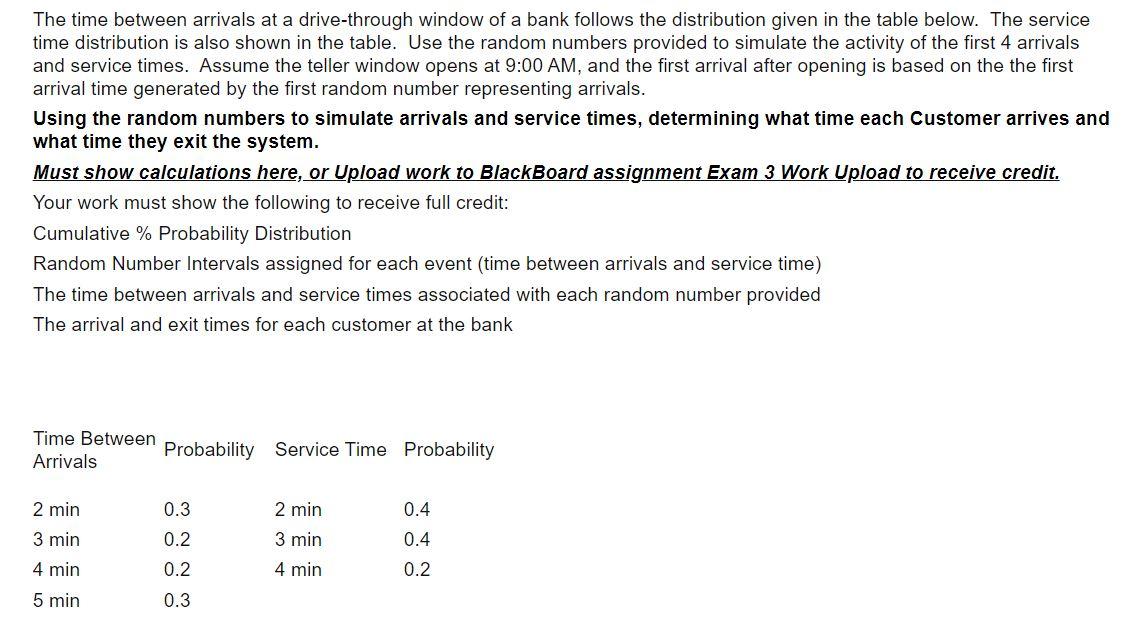
The time between arrivals at a drive-through window of a bank follows the distribution given in the table below. The service time distribution is also
Step by Step Solution
There are 3 Steps involved in it
Step: 1

Get Instant Access to Expert-Tailored Solutions
See step-by-step solutions with expert insights and AI powered tools for academic success
Step: 2

Step: 3
Ace Your Homework with AI
Get the answers you need in no time with our AI-driven, step-by-step assistance
Get Started
Makers And Takers The Rise Of Finance And The Fall Of American Business
Authors: Rana Foroohar
1st Edition
0553447238, 978-0553447231