The topic is Analyzing and Forecasting Time-Series Data
I need help doing these trend analysis problems.
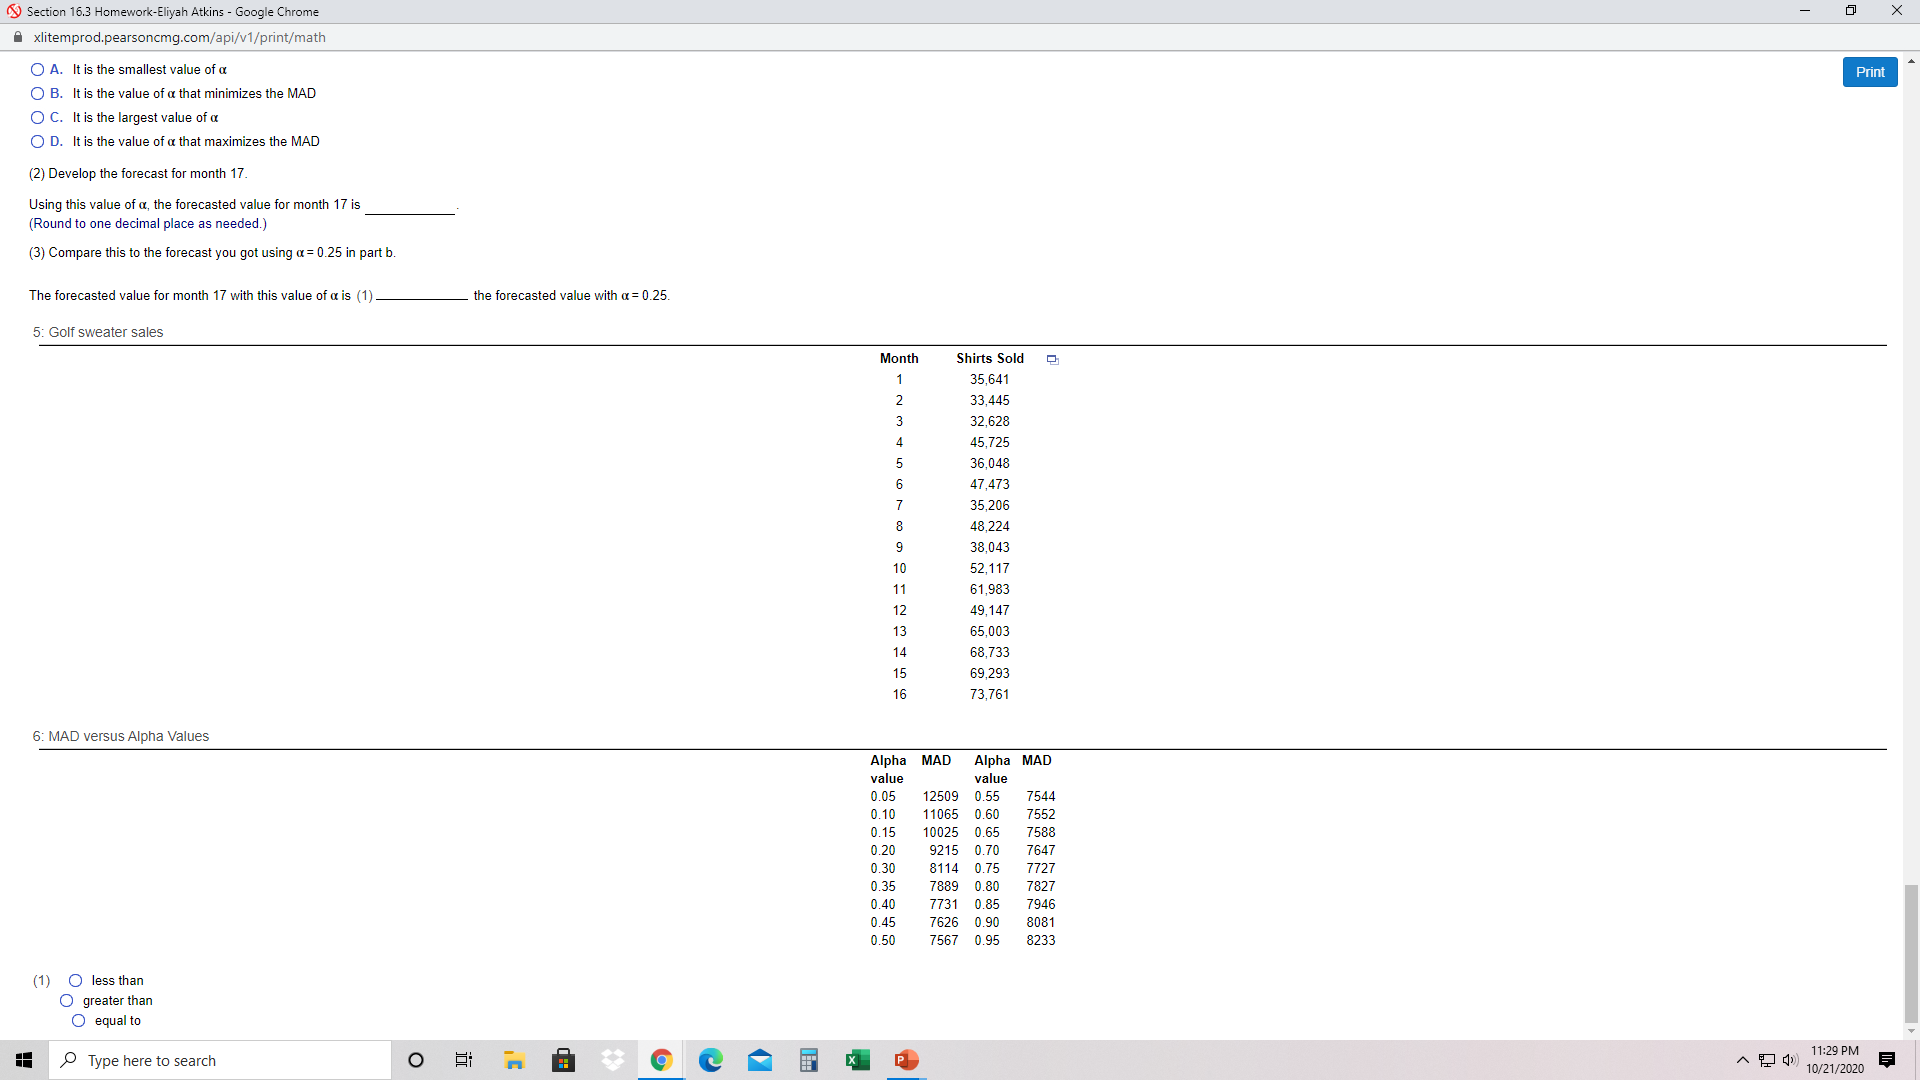
You can use excel to solve the problems with data tables. Please let me know if you need more information on how to solve these problems.
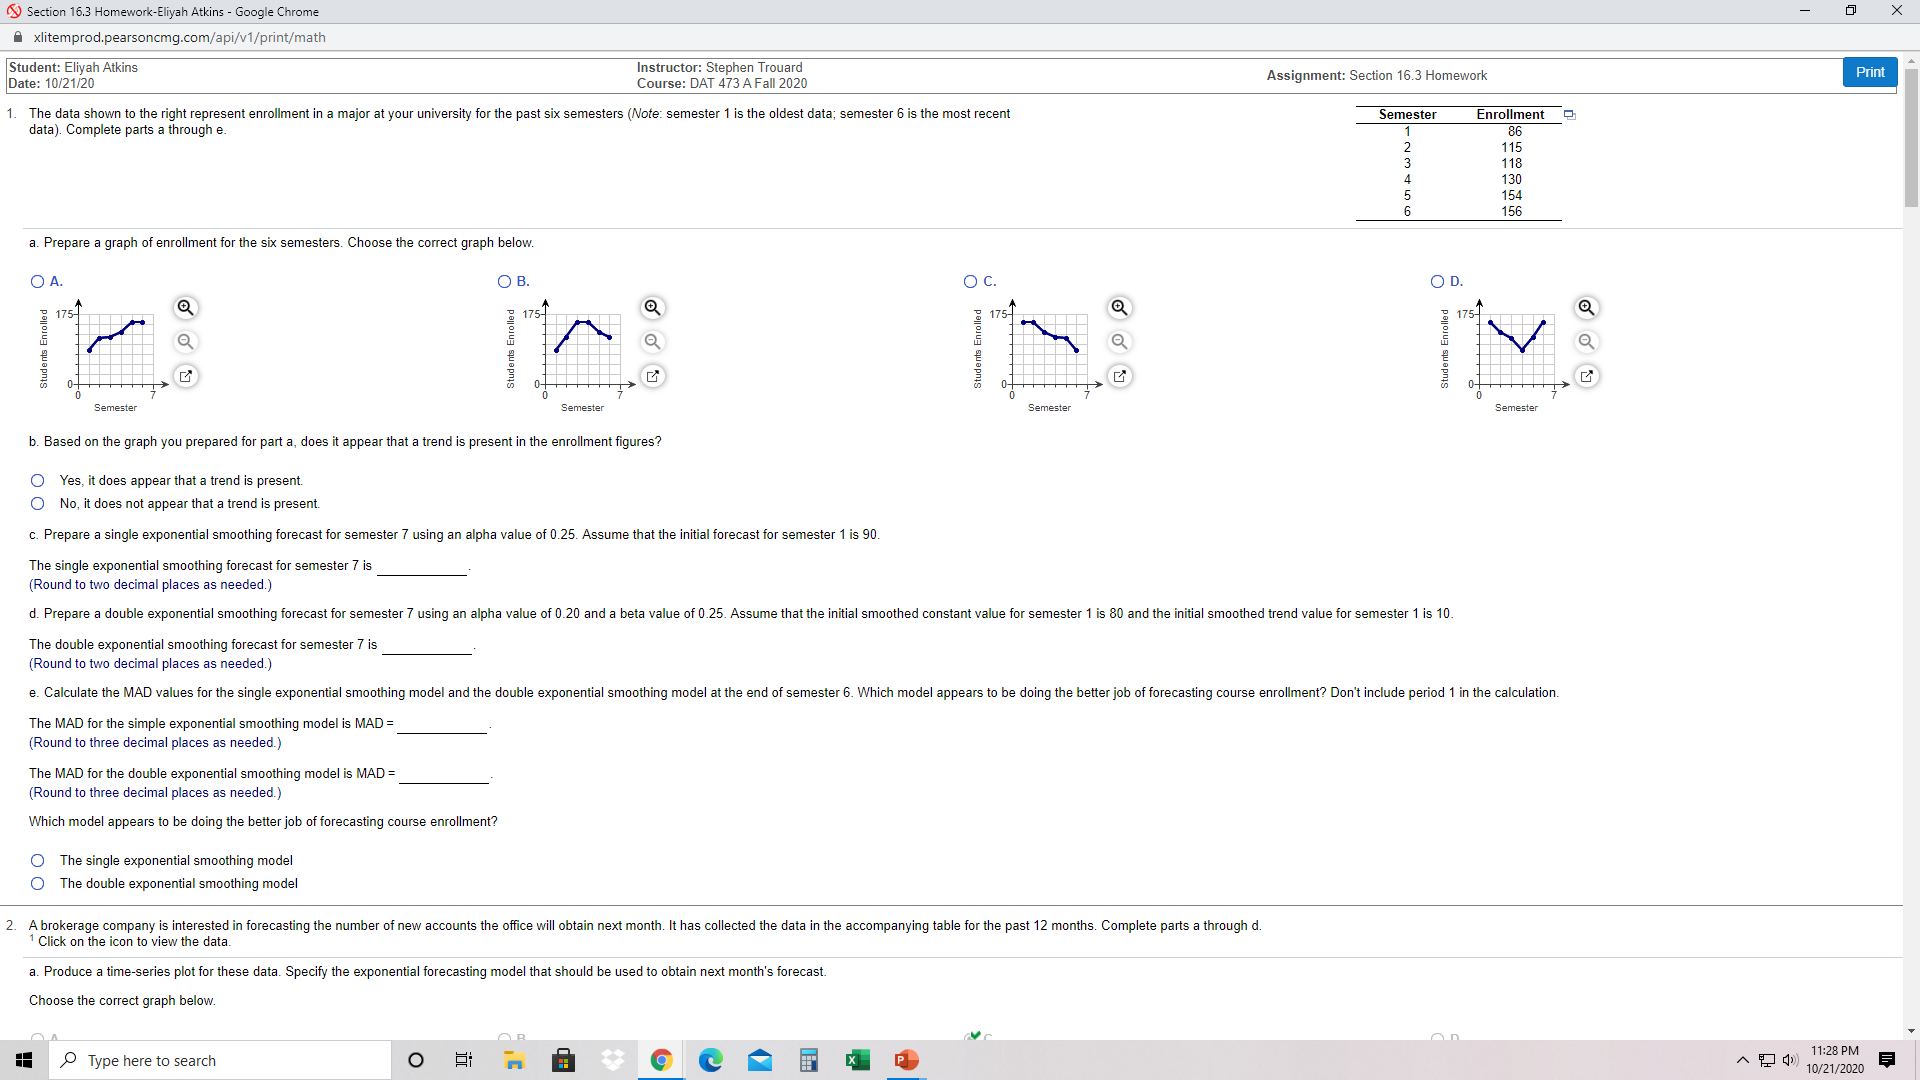
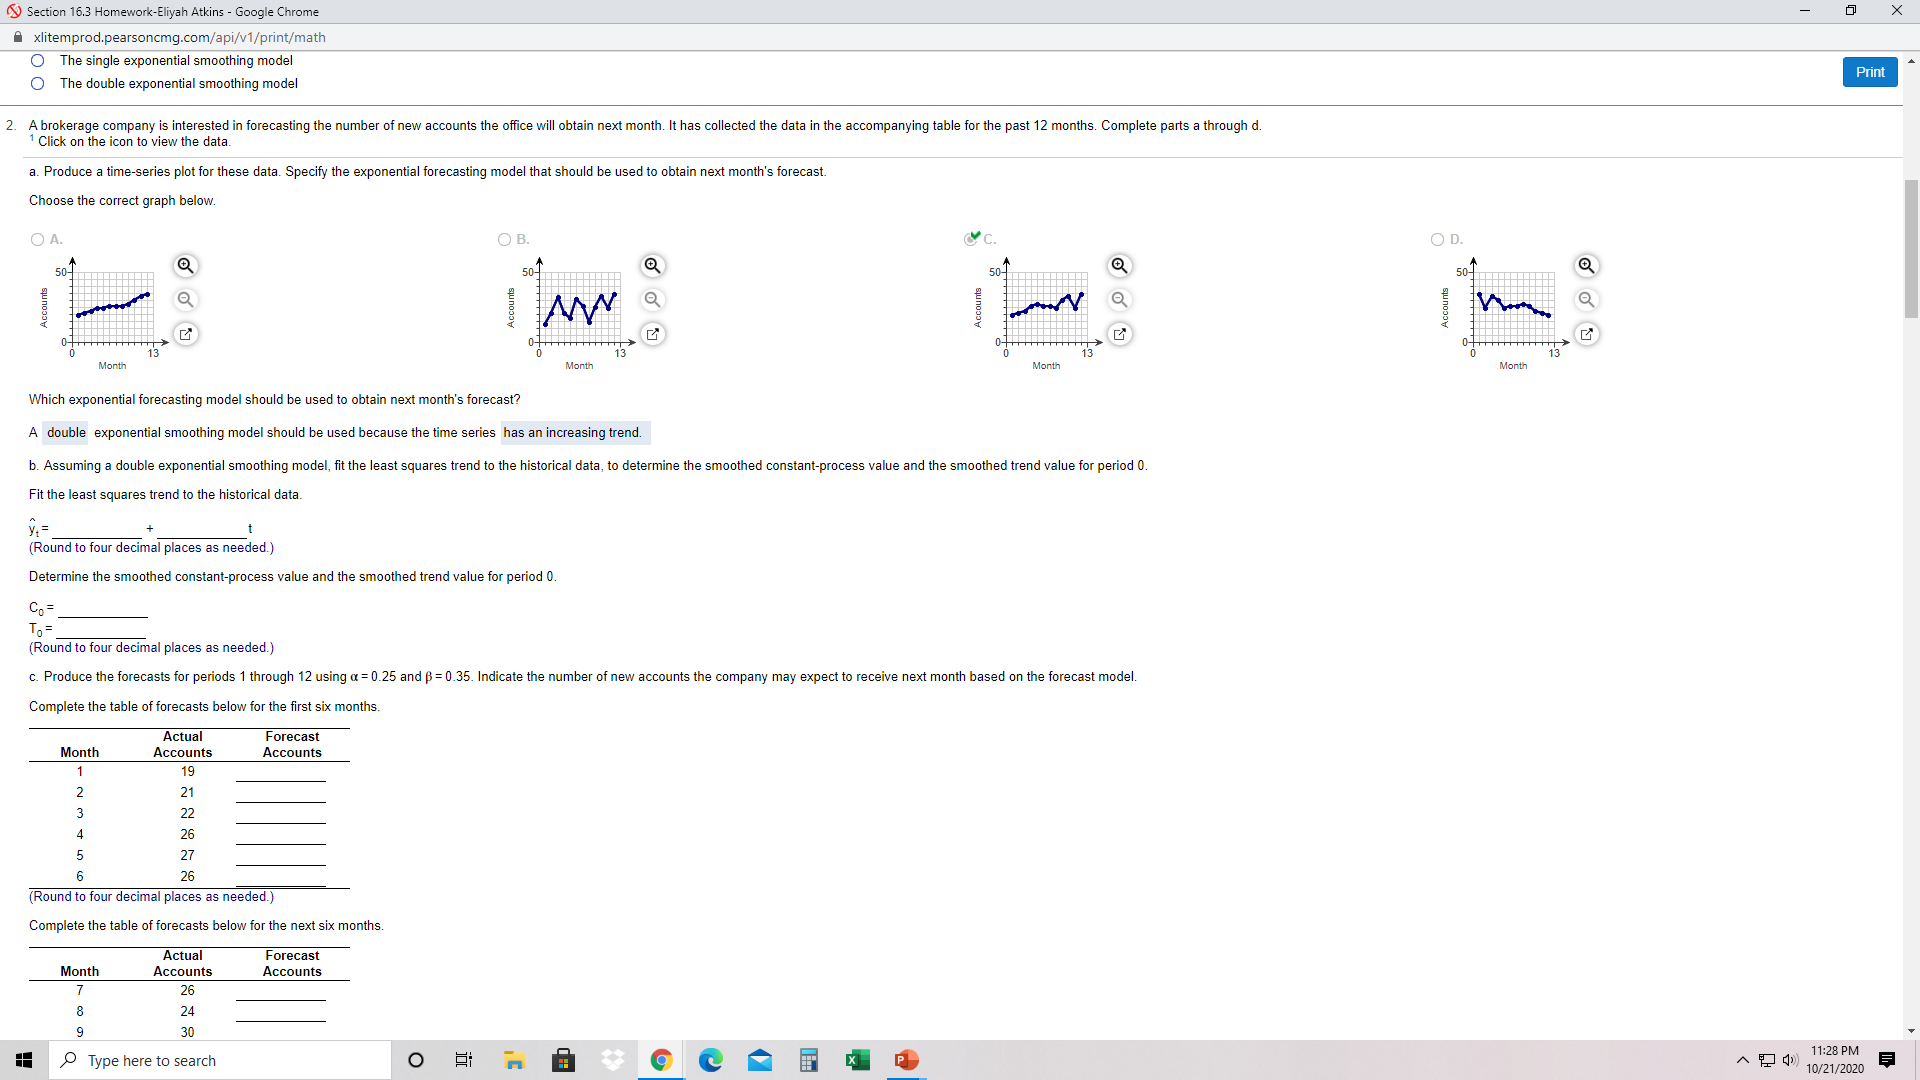
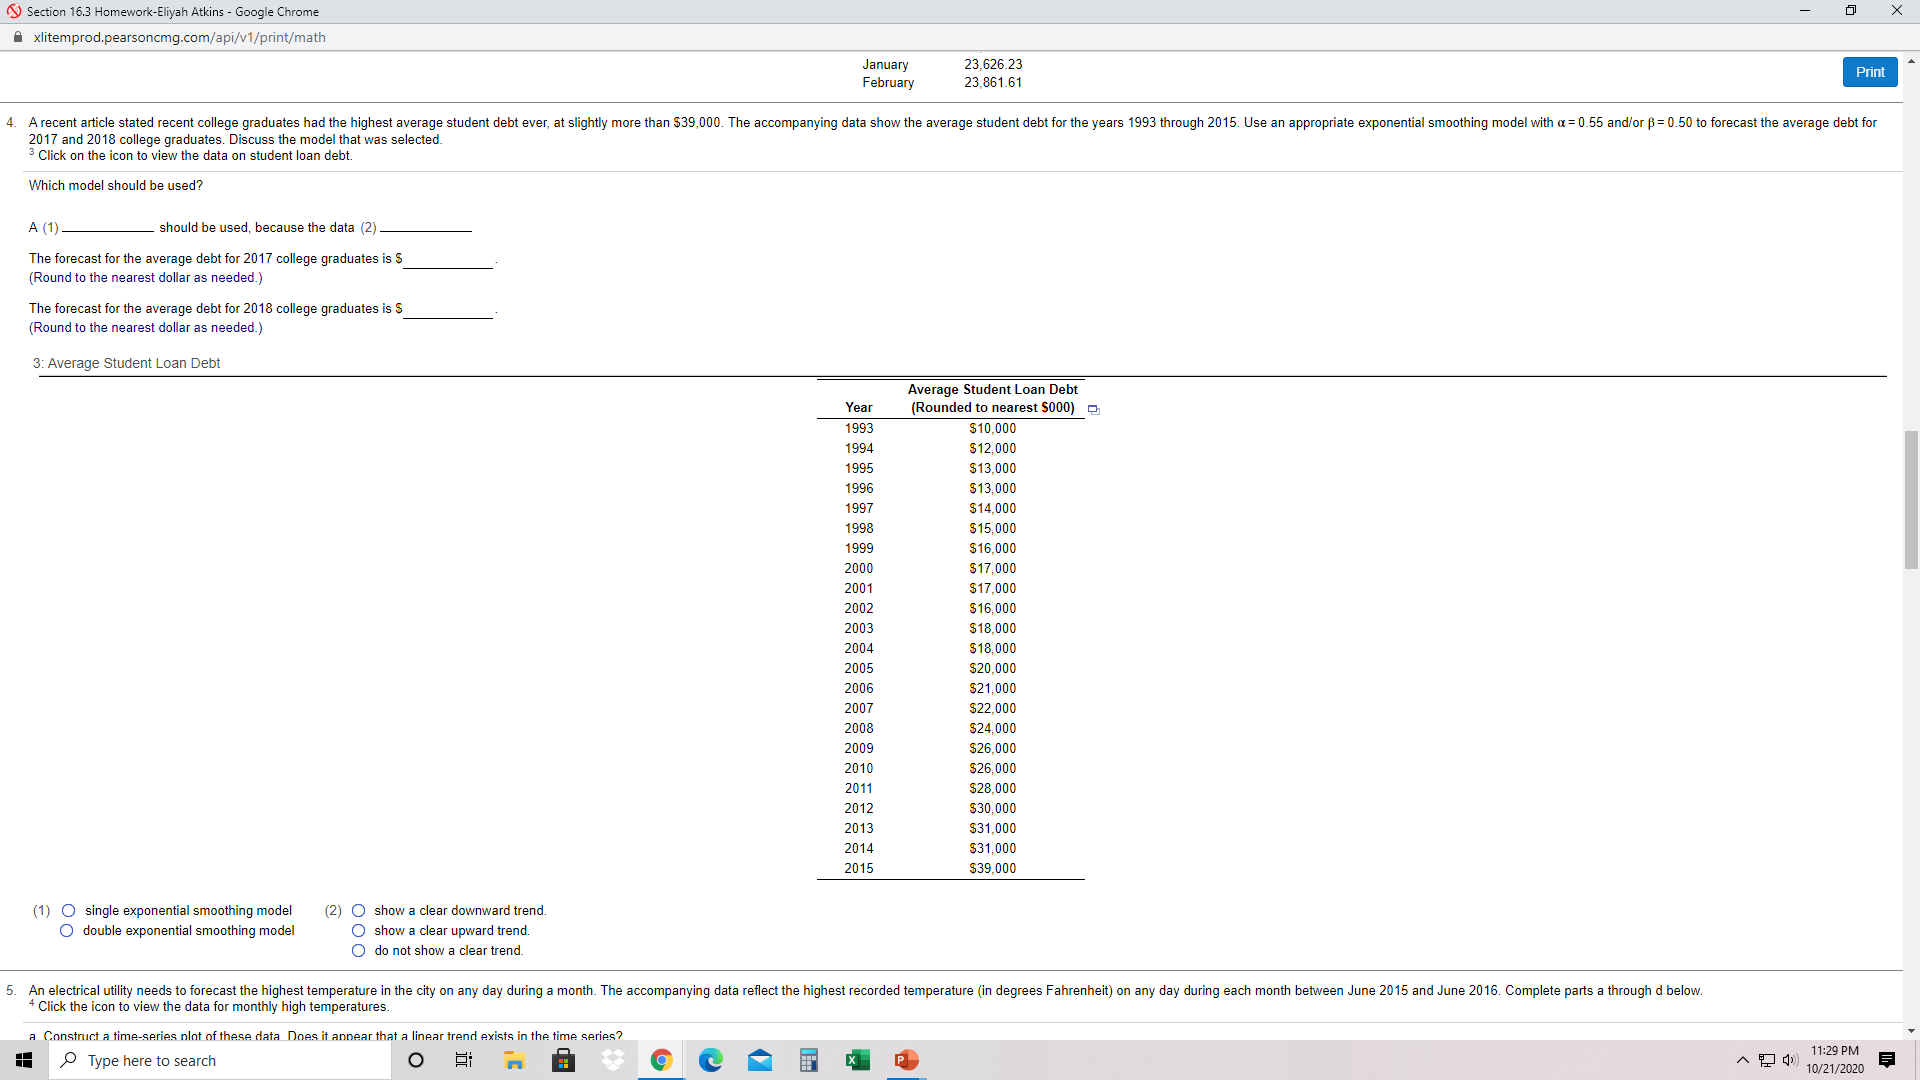
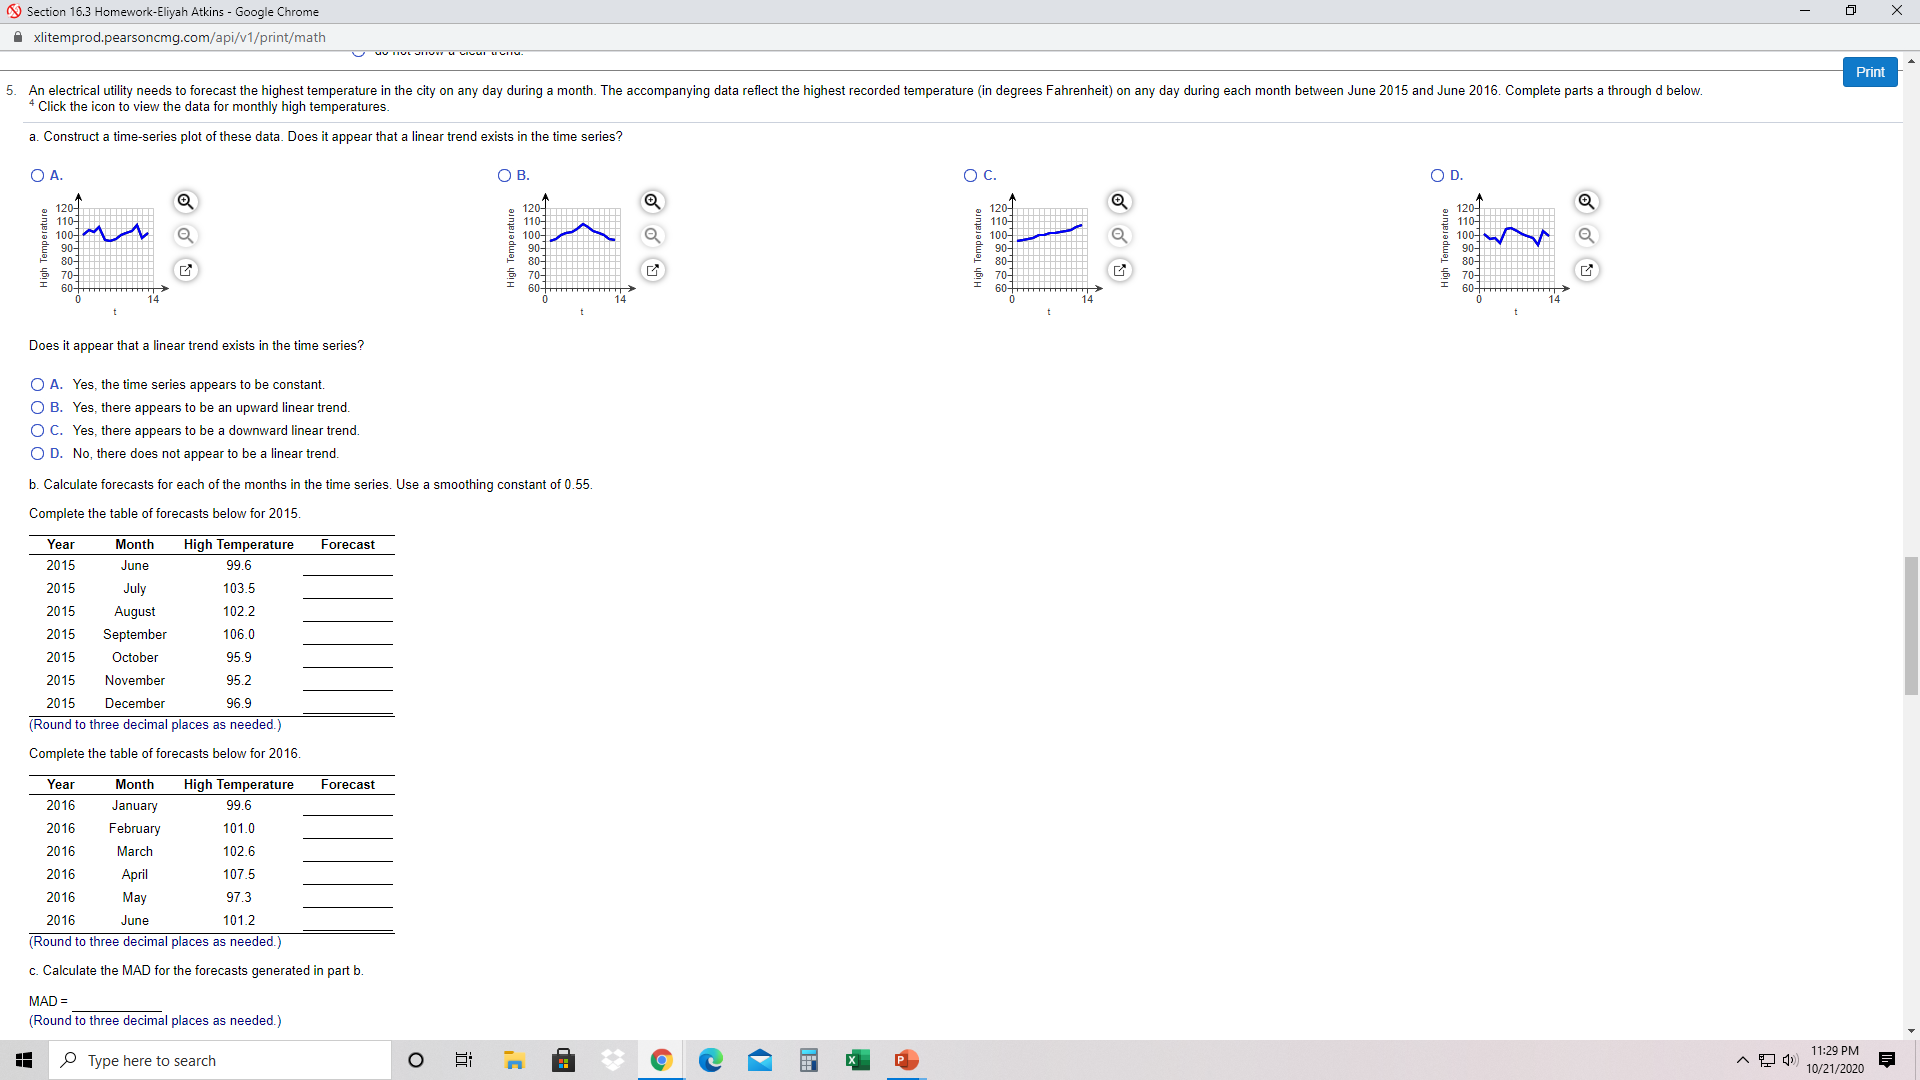
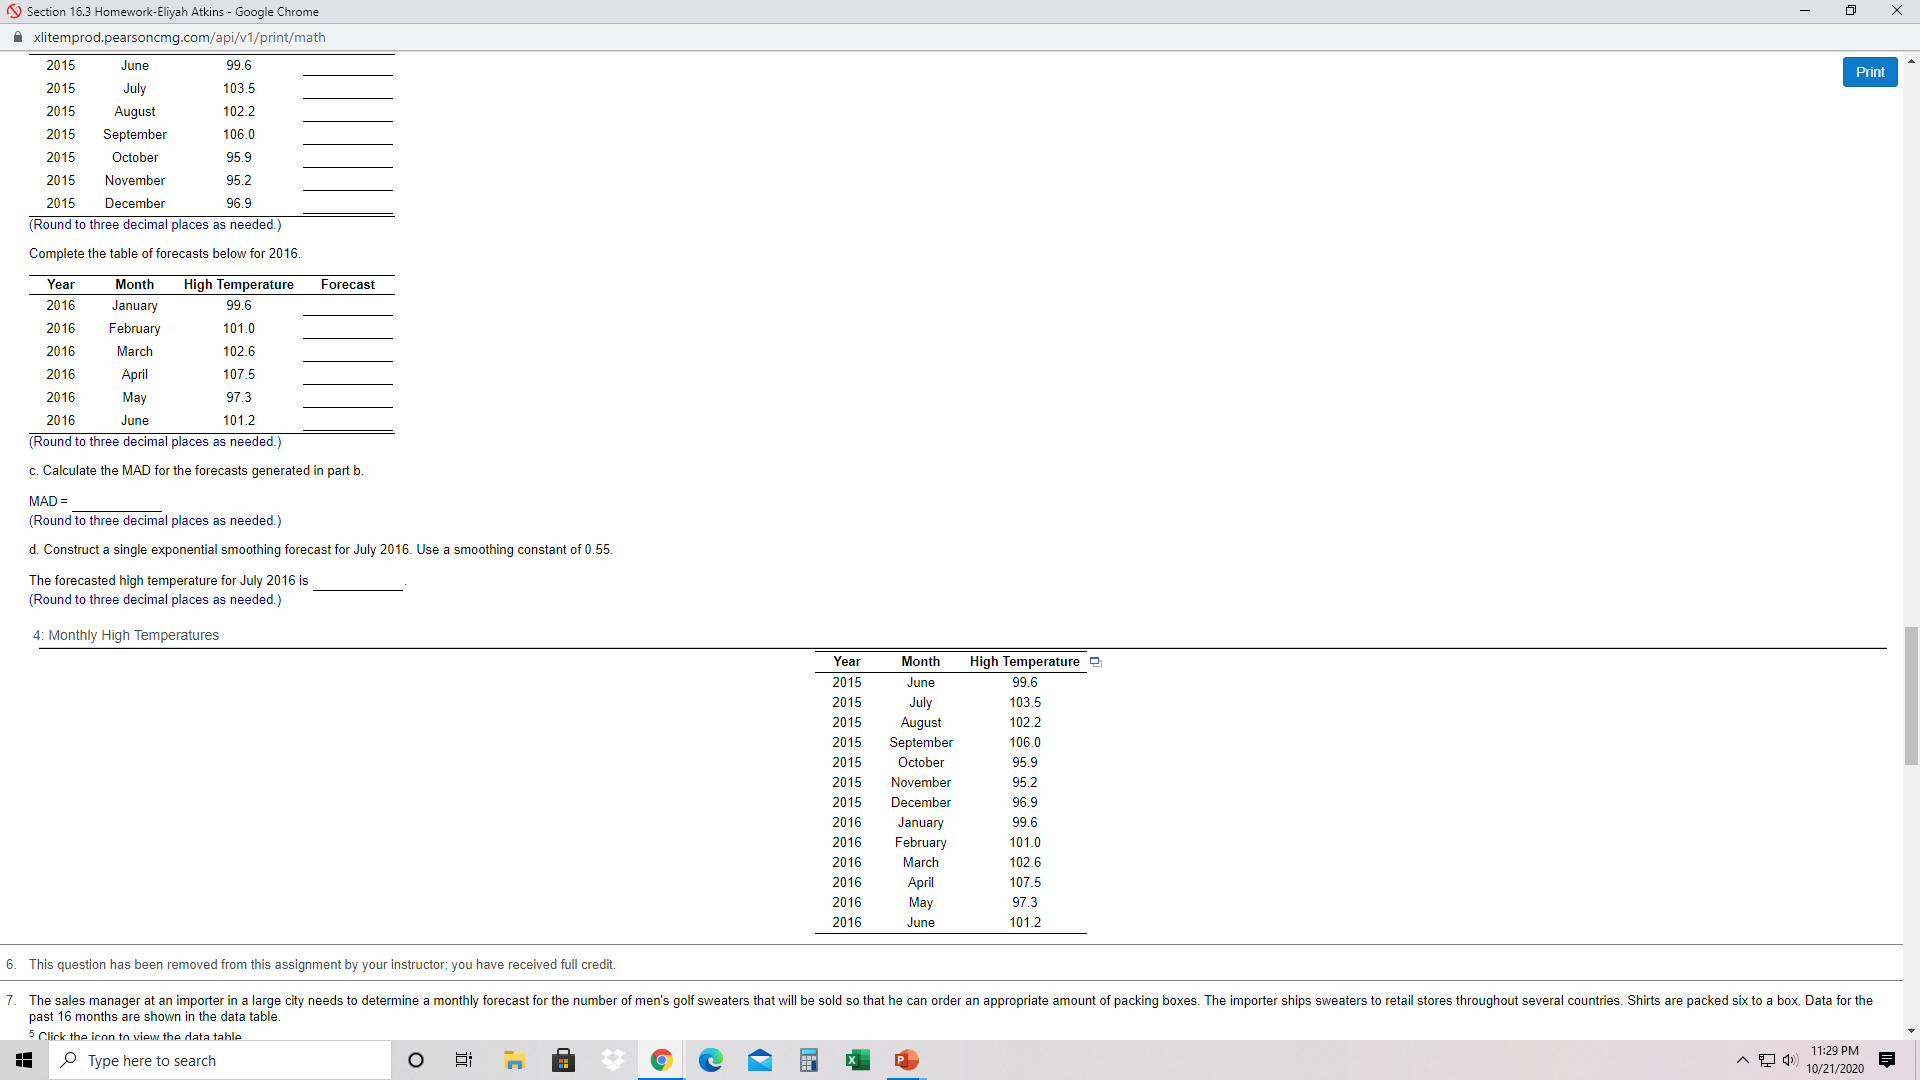
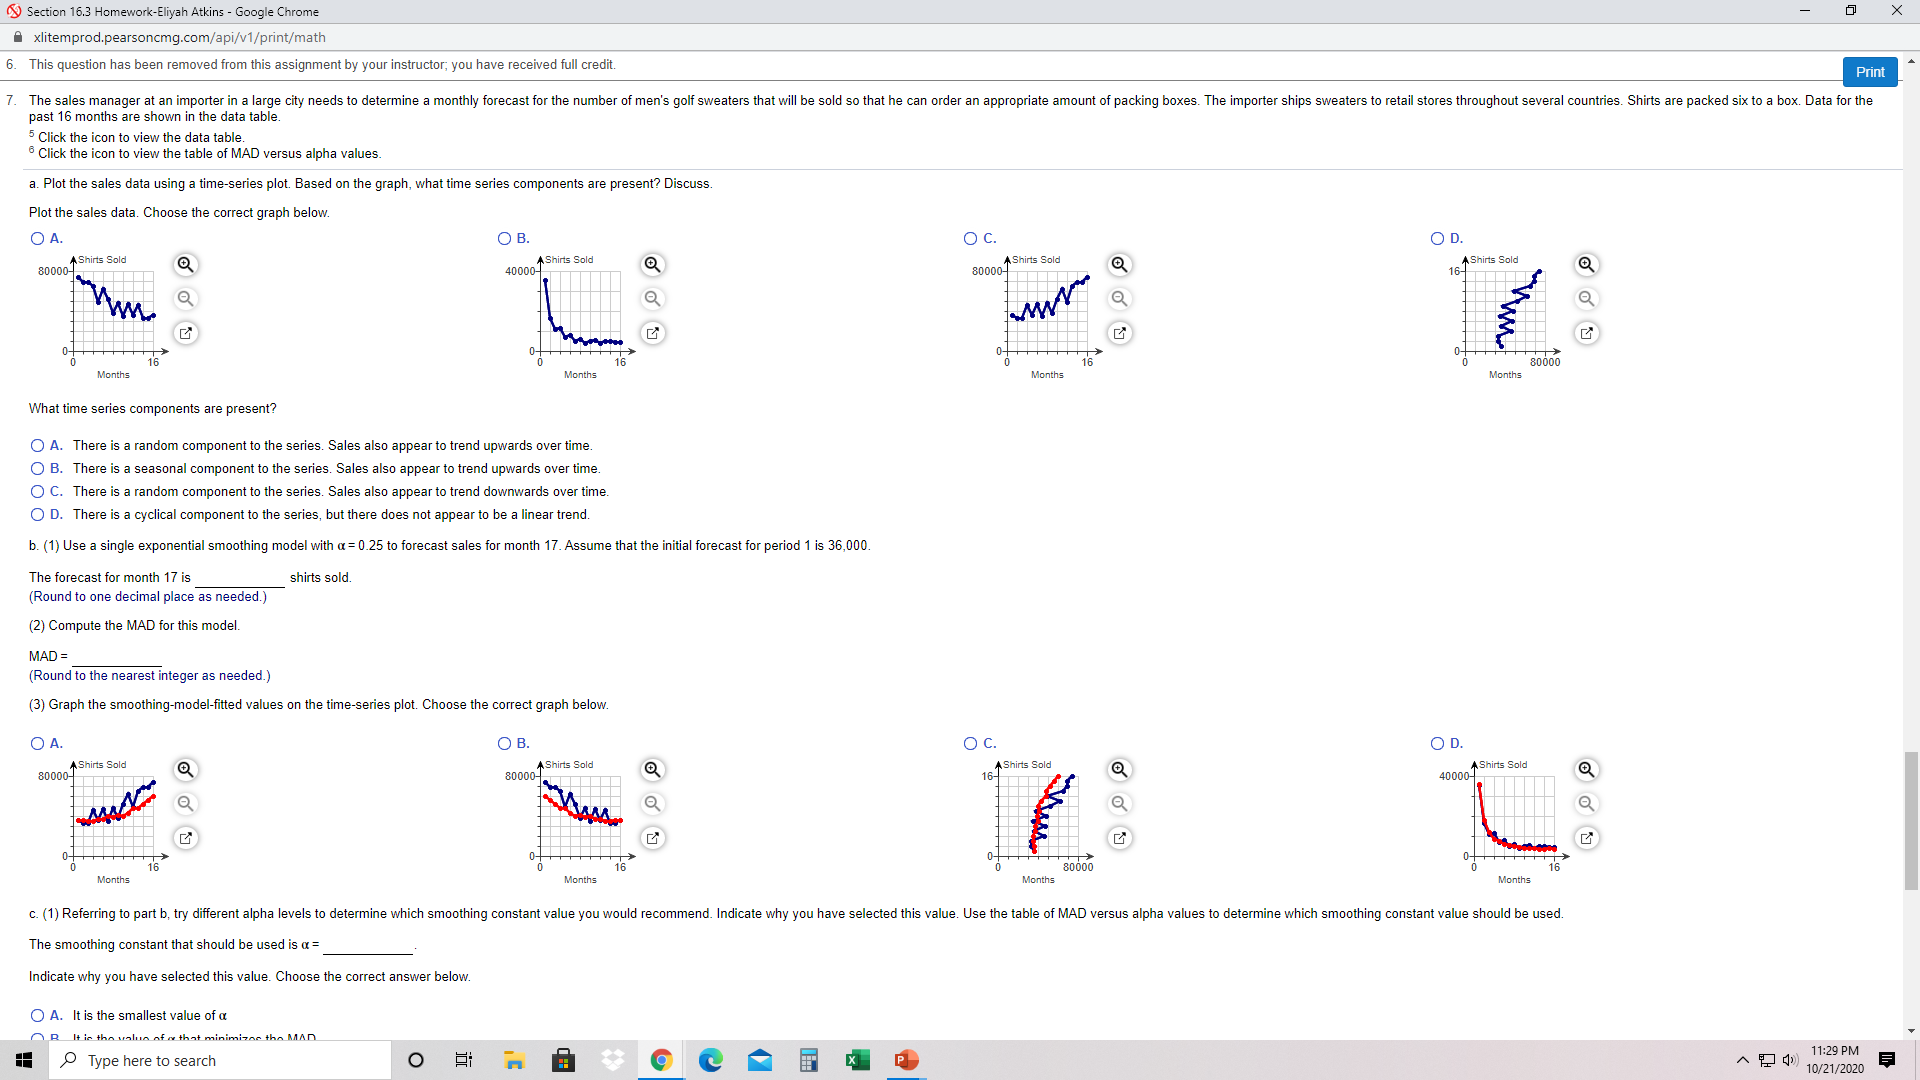
Section 16.3 Homework-Eliyah Atkins - Google Chrome X xlitemprod.pearsoncmg.com/api/v1/print/math Student: Eliyah Atkins Instructor: Stephen Trouard Date: 10/21/20 Course: DAT 473 A Fall 2020 Assignment: Section 16.3 Homework Print 1. The data shown to the right represent enrollment in a major at your university for the past six semesters (Note: semester 1 is the oldest data; semester 6 is the most recent Semester data). Complete parts a through e. Enrollment OUIAWN 86 115 118 130 154 56 a. Prepare a graph of enrollment for the six semesters. Choose the correct graph below. O A. O B. O C. O D. Students Enrolled Students Enrolled 175- Students Enrolled 175- Students Enrolled 175 Semester Semester Semester Semester b. Based on the graph you prepared for part a, does it appear that a trend is present in the enrollment figures? O Yes, it does appear that a trend is present. No, it does not appear that a trend is present. c. Prepare a single exponential smoothing forecast for semester 7 using an alpha value of 0.25. Assume that the initial forecast for semester 1 is 90. The single exponential smoothing forecast for semester 7 is Round to two decimal places as needed.) d. Prepare a double exponential smoothing forecast for semester 7 using an alpha value of 0.20 and a beta value of 0.25. Assume that the initial smoothed constant value for semester 1 is 80 and the initial smoothed trend value for semester 1 is 10. The double exponential smoothing forecast for semester 7 is (Round to two decimal places as needed.) e. Calculate the MAD values for the single exponential smoothing model and the double exponential smoothing model at the end of semester 6. Which model appears to be doing the better job of forecasting course enrollment? Don't include period 1 in the calculation. The MAD for the simple exponential smoothing model is MAD = (Round to three decimal places as needed.) The MAD for the double exponential smoothing model is MAD = (Round to three decimal places as needed.) Which model appears to be doing the better job of forecasting course enrollment? O The single exponential smoothing model The double exponential smoothing model A brokerage company is interested in forecasting the number of new accounts the office will obtain next month. It has collected the data in the accompanying table for the past 12 months. Complete parts a through d. Click on the icon to view the data a. Produce a time-series plot for these data. Specify the exponential forecasting model that should be used to obtain next month's forecast. Choose the correct graph below. OR OD Type here to search O 11:28 PM 10/21/2020Section 16.3 Homework-Eliyah Atkins - Google Chrome X xlitemprod.pearsoncmg.com/api/v1/print/math The single exponential smoothing model The double exponential smoothing model Print 2. A brokerage company is interested in forecasting the number of new accounts the office will obtain next month. It has collected the data in the accompanying table for the past 12 months. Complete parts a through d. Click on the icon to view the data. a. Produce a time-series plot for these data. Specify the exponential forecasting model that should be used to obtain next month's forecast. Choose the correct graph below. O A. O B. VC. OD. Q 50- 50- Accounts Accounts Accounts Accounts IV off Month 13 13 13 Month Month Month Which exponential forecasting model should be used to obtain next month's forecast? A double exponential smoothing model should be used because the time series has an increasing trend. b. Assuming a double exponential smoothing model, fit the least squares trend to the historical data, to determine the smoothed constant-process value and the smoothed trend value for period 0. Fit the least squares trend to the historical data. (Round to four decimal places as needed.) Determine the smoothed constant-process value and the smoothed trend value for period 0. To = (Round to four decimal places as needed.) c. Produce the forecasts for periods 1 through 12 using