Question
The total precipitation in Normal City in January is approximately normally distributed with a mean of 3.2 inches, and a standard deviation of 0.69. A
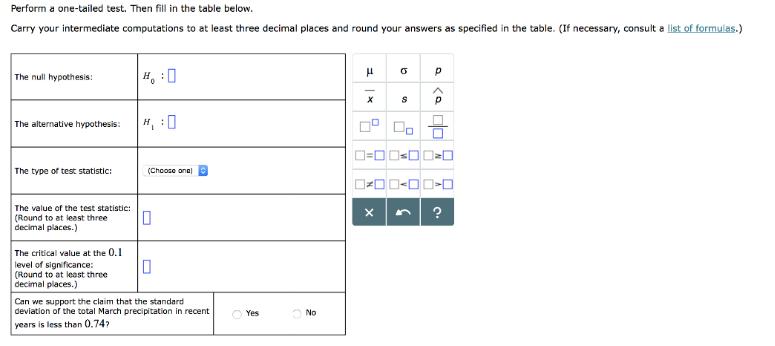
The total precipitation in Normal City in January is approximately normally distributed with a mean of 3.2 inches, and a standard deviation of 0.69. A researcher claims that the standard deviation, σ, of the total March precipitation in recent years is less than 0.69. A random sample of 18 precipitation measurements from the last three decades is considered and the mean of these measurements is found to be 3.1 with a standard deviation of 0.45. Is there enough evidence to support the researcher's claim at the 0.1 level of significance?

Perform a one-tailed test. Then fill in the table below. Carry your intermediate computations to at leest three decimal places and round your answers as specified in the table. (If necessary, consult a list of formuias.) H, :0 The null hypothesis: ", :0 The alternative hypothesis: The type of test statistic: (Choose one The value of the test statistic: (Round to at least three decimal places.) The critical value at the 0.1 level of significance: (Round to at least three decimal places.) Can we support the claim that the standard deviation of the total March precipitation in recent Yes No years is less than 0.74?
Step by Step Solution
3.54 Rating (175 Votes )
There are 3 Steps involved in it
Step: 1
Here we have given that X The total precipitation in Normal city n number of precipitation measu...
Get Instant Access to Expert-Tailored Solutions
See step-by-step solutions with expert insights and AI powered tools for academic success
Step: 2

Step: 3

Ace Your Homework with AI
Get the answers you need in no time with our AI-driven, step-by-step assistance
Get Started


