

Question
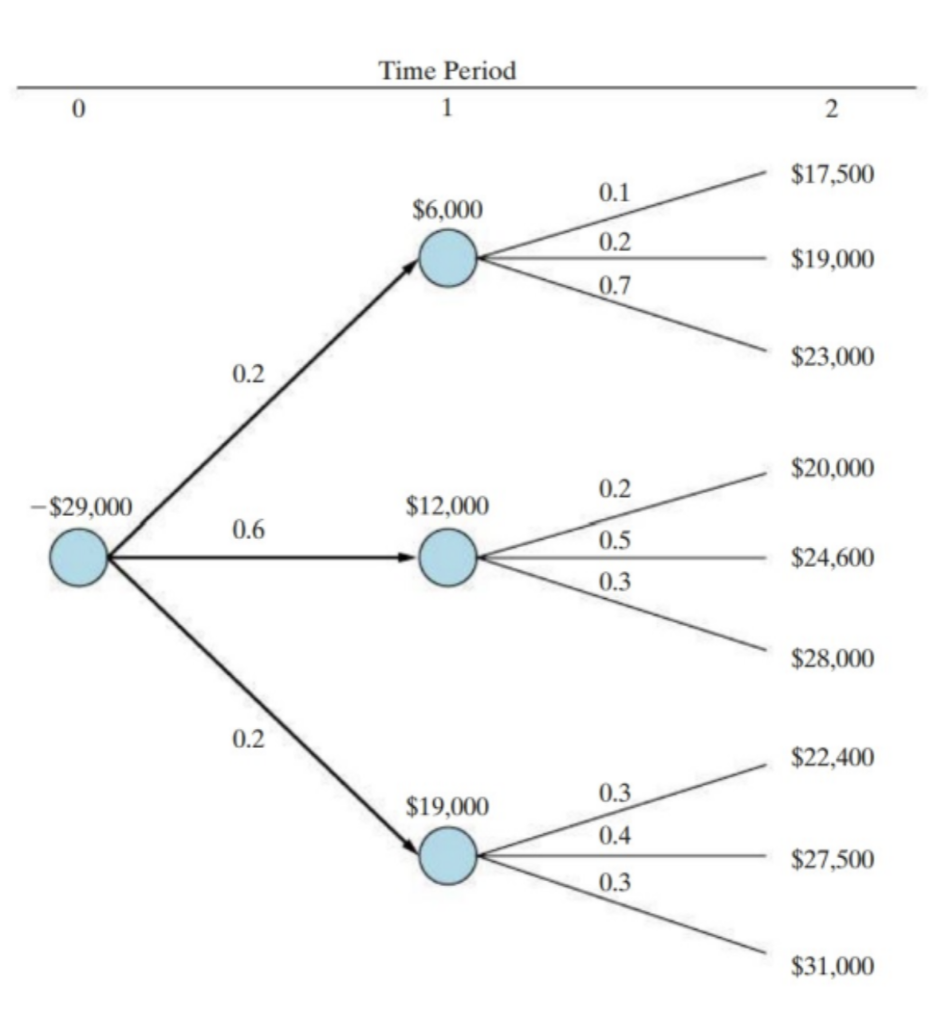
The tree diagram in the figure describes the uncertain cash flows for an engineering project. The analysis period is two years, and MARR =15% per
The tree diagram in the figure describes the uncertain cash flows for an engineering project. The analysis period is two years, and MARR =15% per year. Based on this information, (a) What are the E(PW), Var(PW)of the project? (b) What is the probability that PW > 0?
Step by Step Solution
There are 3 Steps involved in it
Step: 1

Get Instant Access to Expert-Tailored Solutions
See step-by-step solutions with expert insights and AI powered tools for academic success
Step: 2

Step: 3
Ace Your Homework with AI
Get the answers you need in no time with our AI-driven, step-by-step assistance
Get Started
Credit Rating Agencies On The Watch List Analysis Of European Regulation
Authors: Raquel García Alcubilla , Javier Ruiz Del Pozo
1st Edition
0199608865,0191640999