

Question
The two cases (slide 1 versus slide 2) demonstrates that at the same 20% growth (and the same assumption that Debt-Equity Ratios stay constant year
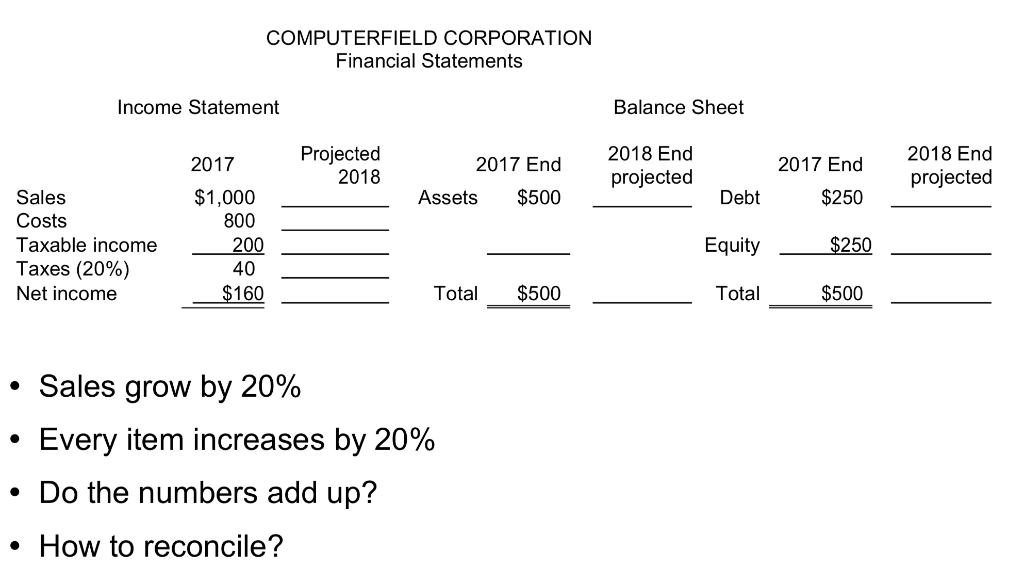
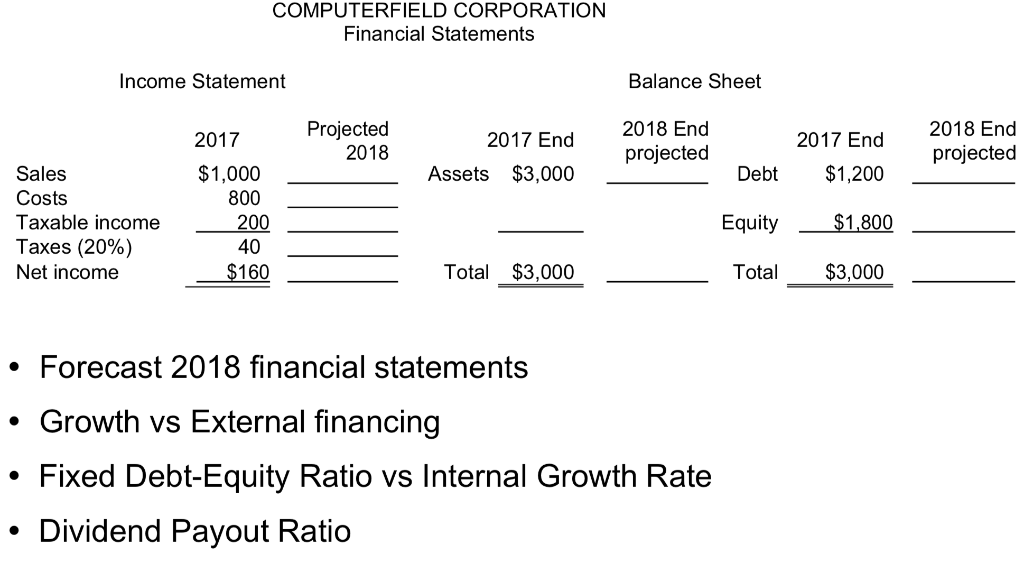
The two cases (slide 1 versus slide 2) demonstrates that at the same 20% growth (and the same assumption that Debt-Equity Ratios stay constant year to year) into the next year for both cases, slide 2 does not need EFN (rather, slide 2 could afford to pay out some dividend in the next year), but slide 3 does need EFN.
Please explain what fundamentally gives rise to the difference? Try to relate your explanation to the Sustainable Growth Rate (as well as the SGR formula given in the textbook), ROE and other concepts if needed. Show algebra if it helps.
COMPUTERFIELD CORPORATION Financial Statements Income Statement Balance Sheet 2017 Projected 2018 2017 End 2018 End projected 2017 End 2018 End projected Assets $500 Debt $250 Sales Costs Taxable income Taxes (20%) Net income $1,000 800 200 40 $160 Equity $250 Total $500 Total $500 Sales grow by 20% Every item increases by 20% Do the numbers add up? How to reconcile? COMPUTERFIELD CORPORATION Financial Statements Income Statement Balance Sheet 2017 Projected 2018 2018 End projected 2017 End 2017 End Assets $3,000 2018 End projected Debt $1,200 Sales Costs Taxable income Taxes (20%) Net income $1,000 800 200 40 $160 Equity $1,800 Total $3,000 Total $3,000 Forecast 2018 financial statements Growth vs External financing Fixed Debt-Equity Ratio vs Internal Growth Rate Dividend Payout Ratio COMPUTERFIELD CORPORATION Financial Statements Income Statement Balance Sheet 2017 Projected 2018 2017 End 2018 End projected 2017 End 2018 End projected Assets $500 Debt $250 Sales Costs Taxable income Taxes (20%) Net income $1,000 800 200 40 $160 Equity $250 Total $500 Total $500 Sales grow by 20% Every item increases by 20% Do the numbers add up? How to reconcile? COMPUTERFIELD CORPORATION Financial Statements Income Statement Balance Sheet 2017 Projected 2018 2018 End projected 2017 End 2017 End Assets $3,000 2018 End projected Debt $1,200 Sales Costs Taxable income Taxes (20%) Net income $1,000 800 200 40 $160 Equity $1,800 Total $3,000 Total $3,000 Forecast 2018 financial statements Growth vs External financing Fixed Debt-Equity Ratio vs Internal Growth Rate Dividend Payout RatioStep by Step Solution
There are 3 Steps involved in it
Step: 1

Get Instant Access to Expert-Tailored Solutions
See step-by-step solutions with expert insights and AI powered tools for academic success
Step: 2

Step: 3
Ace Your Homework with AI
Get the answers you need in no time with our AI-driven, step-by-step assistance
Get Started
Personal Finance
Authors: Richard Stanton
2nd Edition
1519662106, 978-1519662101