

Answered step by step
Verified Expert Solution
Question
1 Approved Answer
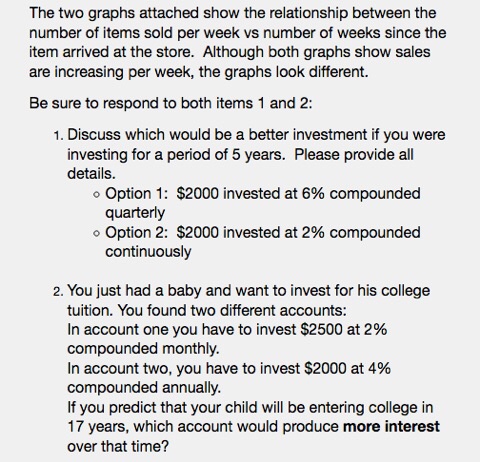
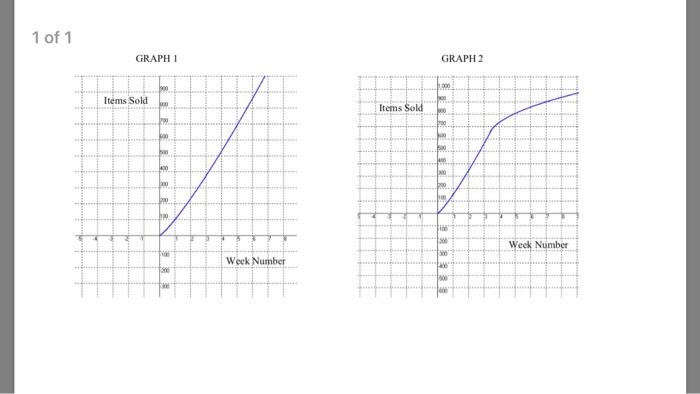
The two graphs attached show the relationship between the number of items sold per week vs number of weeks since the item arrived at the
Step by Step Solution
There are 3 Steps involved in it
Step: 1

Get Instant Access to Expert-Tailored Solutions
See step-by-step solutions with expert insights and AI powered tools for academic success
Step: 2

Step: 3
Ace Your Homework with AI
Get the answers you need in no time with our AI-driven, step-by-step assistance
Get Started
Challenging Global Finance
Authors: Elizabeth Friesen
2012th Edition
0230348793, 978-0230348790