Answered step by step
Verified Expert Solution
Question
1 Approved Answer
The unemployment rate is a long-standing key labour market indicator, widely used around the world to communicate on the performance of the labour market

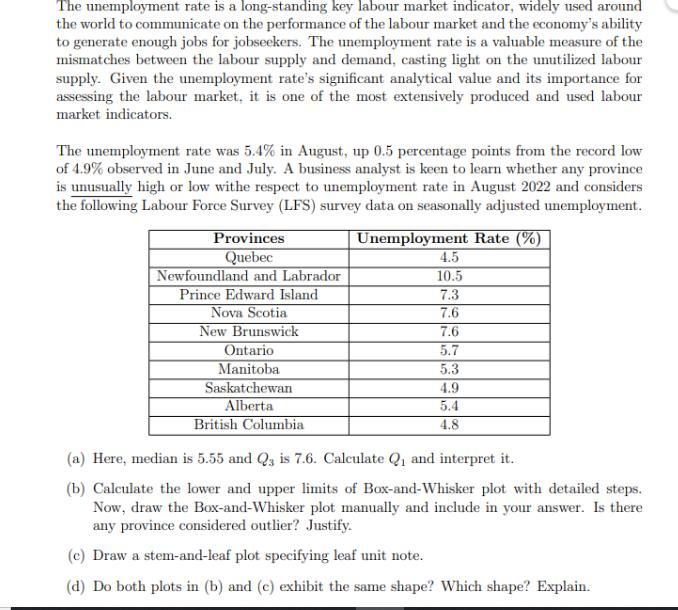
The unemployment rate is a long-standing key labour market indicator, widely used around the world to communicate on the performance of the labour market and the economy's ability to generate enough jobs for jobseekers. The unemployment rate is a valuable measure of the mismatches between the labour supply and demand, casting light on the unutilized labour supply. Given the unemployment rate's significant analytical value and its importance for assessing the labour market, it is one of the most extensively produced and used labour market indicators. The unemployment rate was 5.4% in August, up 0.5 percentage points from the record low of 4.9 % observed in June and July. A business analyst is keen to learn whether any province is unusually high or low withe respect to unemployment rate in August 2022 and considers the following Labour Force Survey (LFS) survey data on seasonally adjusted unemployment. Unemployment Rate (%) Provinces Quebec Newfoundland and Labrador Prince Edward Island Nova Scotia New Brunswick Ontario Manitoba Saskatchewan Alberta British Columbia 10.5 7.3 7.6 7.6 5.7 5.3 4.9 5.4 4.8 (a) Here, median is 5.55 and Q3 is 7.6. Calculate Q and interpret it. (b) Calculate the lower and upper limits of Box-and-Whisker plot with detailed steps. Now, draw the Box-and-Whisker plot manually and include in your answer. Is there any province considered outlier? Justify. (c) Draw a stem-and-leaf plot specifying leaf unit note. (d) Do both plots in (b) and (c) exhibit the same shape? Which shape? Explain.
Step by Step Solution
There are 3 Steps involved in it
Step: 1
a To calculate the interquartile range IQR we need to find the first quartile Q1 and the third quart...
Get Instant Access to Expert-Tailored Solutions
See step-by-step solutions with expert insights and AI powered tools for academic success
Step: 2

Step: 3

Ace Your Homework with AI
Get the answers you need in no time with our AI-driven, step-by-step assistance
Get Started


