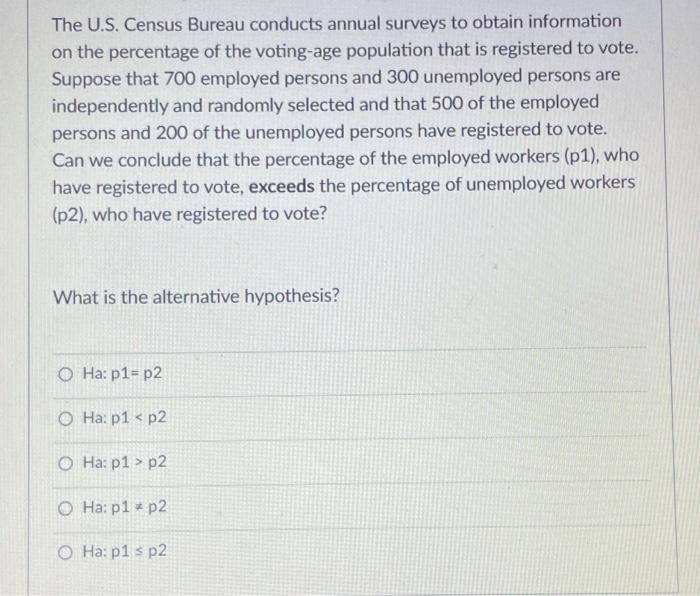
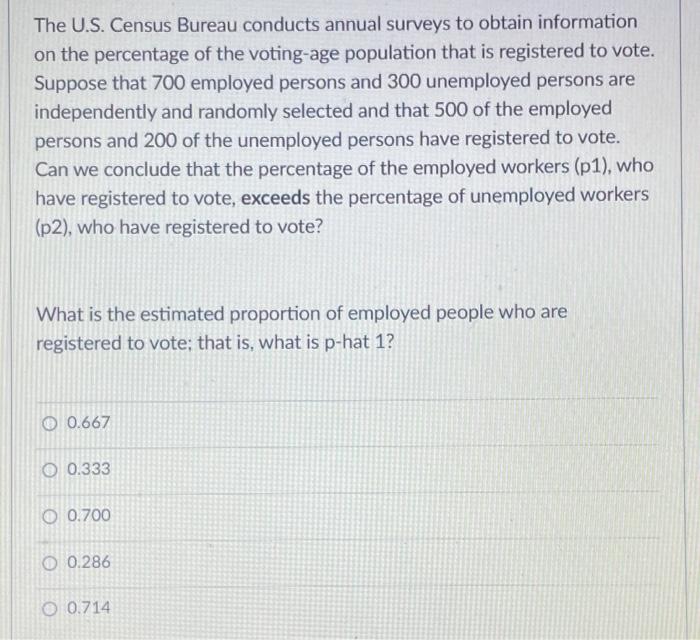
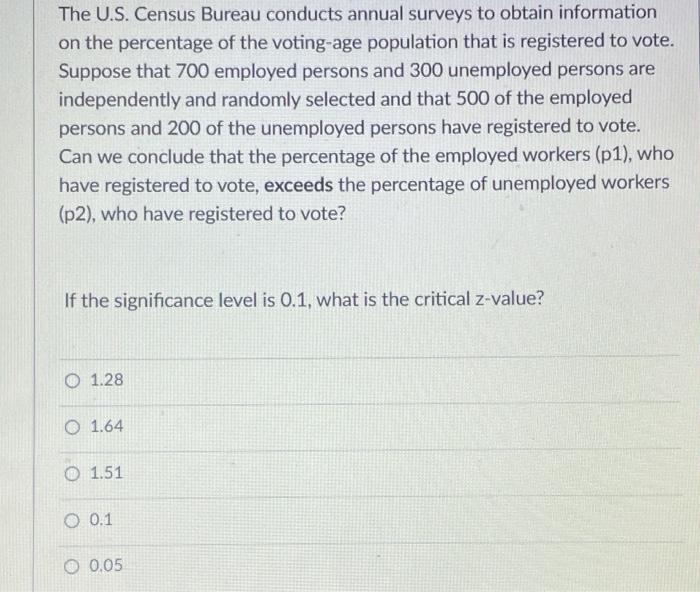
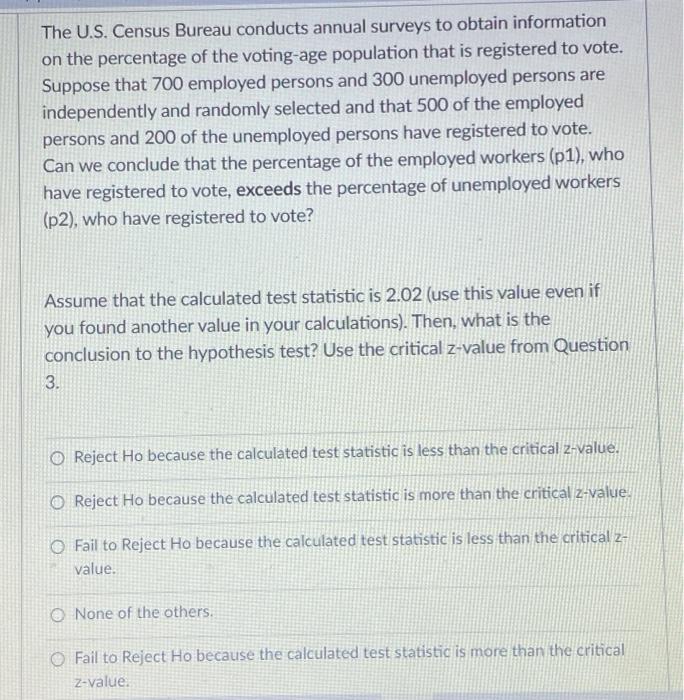
The U.S. Census Bureau conducts annual surveys to obtain information on the percentage of the voting-age population that is registered to vote. Suppose that 700 employed persons and 300 unemployed persons are independently and randomly selected and that 500 of the employed persons and 200 of the unemployed persons have registered to vote. Can we conclude that the percentage of the employed workers (p1), who have registered to vote, exceeds the percentage of unemployed workers (p2), who have registered to vote? What is the alternative hypothesis? O Ha: p1=p2 O Ha: p1 p2 O Ha: p1.p2 O Ha: p1 s p2 The U.S. Census Bureau conducts annual surveys to obtain information on the percentage of the voting-age population that is registered to vote. Suppose that 700 employed persons and 300 unemployed persons are independently and randomly selected and that 500 of the employed persons and 200 of the unemployed persons have registered to vote. Can we conclude that the percentage of the employed workers (p1), who have registered to vote, exceeds the percentage of unemployed workers (p2), who have registered to vote? What is the estimated proportion of employed people who are registered to vote; that is, what is p-hat 1? O 0.667 O 0.333 O 0.700 O 0.286 O 0.714 The U.S. Census Bureau conducts annual surveys to obtain information on the percentage of the voting-age population that is registered to vote. Suppose that 700 employed persons and 300 unemployed persons are independently and randomly selected and that 500 of the employed persons and 200 of the unemployed persons have registered to vote. Can we conclude that the percentage of the employed workers (p1), who have registered to vote, exceeds the percentage of unemployed workers (p2), who have registered to vote? If the significance level is 0.1, what is the critical z-value? O 1.28 O 1.64 1.51 O 0.1 0.05 The U.S. Census Bureau conducts annual surveys to obtain information on the percentage of the voting-age population that is registered to vote. Suppose that 700 employed persons and 300 unemployed persons are independently and randomly selected and that 500 of the employed persons and 200 of the unemployed persons have registered to vote. Can we conclude that the percentage of the employed workers (p1), who have registered to vote, exceeds the percentage of unemployed workers (p2), who have registered to vote? Assume that the calculated test statistic is 2.02 (use this value even if you found another value in your calculations). Then, what is the conclusion to the hypothesis test? Use the critical z-value from Question 3. O Reject Ho because the calculated test statistic is less than the critical 2-value. O Reject Ho because the calculated test statistic is more than the critical z-value O Fail to Reject Ho because the calculated test statistic is less than the critical 2- value. None of the others. Fail to Reject Ho because the calculated test statistic is more than the critical z-value The U.S. Census Bureau conducts annual surveys to obtain information on the percentage of the voting-age population that is registered to vote. Suppose that 700 employed persons and 300 unemployed persons are independently and randomly selected and that 500 of the employed persons and 200 of the unemployed persons have registered to vote. Can we conclude that the percentage of the employed workers (p1), who have registered to vote, exceeds the percentage of unemployed workers (p2), who have registered to vote? What is the alternative hypothesis? O Ha: p1=p2 O Ha: p1 p2 O Ha: p1.p2 O Ha: p1 s p2 The U.S. Census Bureau conducts annual surveys to obtain information on the percentage of the voting-age population that is registered to vote. Suppose that 700 employed persons and 300 unemployed persons are independently and randomly selected and that 500 of the employed persons and 200 of the unemployed persons have registered to vote. Can we conclude that the percentage of the employed workers (p1), who have registered to vote, exceeds the percentage of unemployed workers (p2), who have registered to vote? What is the estimated proportion of employed people who are registered to vote; that is, what is p-hat 1? O 0.667 O 0.333 O 0.700 O 0.286 O 0.714 The U.S. Census Bureau conducts annual surveys to obtain information on the percentage of the voting-age population that is registered to vote. Suppose that 700 employed persons and 300 unemployed persons are independently and randomly selected and that 500 of the employed persons and 200 of the unemployed persons have registered to vote. Can we conclude that the percentage of the employed workers (p1), who have registered to vote, exceeds the percentage of unemployed workers (p2), who have registered to vote? If the significance level is 0.1, what is the critical z-value? O 1.28 O 1.64 1.51 O 0.1 0.05 The U.S. Census Bureau conducts annual surveys to obtain information on the percentage of the voting-age population that is registered to vote. Suppose that 700 employed persons and 300 unemployed persons are independently and randomly selected and that 500 of the employed persons and 200 of the unemployed persons have registered to vote. Can we conclude that the percentage of the employed workers (p1), who have registered to vote, exceeds the percentage of unemployed workers (p2), who have registered to vote? Assume that the calculated test statistic is 2.02 (use this value even if you found another value in your calculations). Then, what is the conclusion to the hypothesis test? Use the critical z-value from Question 3. O Reject Ho because the calculated test statistic is less than the critical 2-value. O Reject Ho because the calculated test statistic is more than the critical z-value O Fail to Reject Ho because the calculated test statistic is less than the critical 2- value. None of the others. Fail to Reject Ho because the calculated test statistic is more than the critical z-value