Answered step by step
Verified Expert Solution
Question
1 Approved Answer
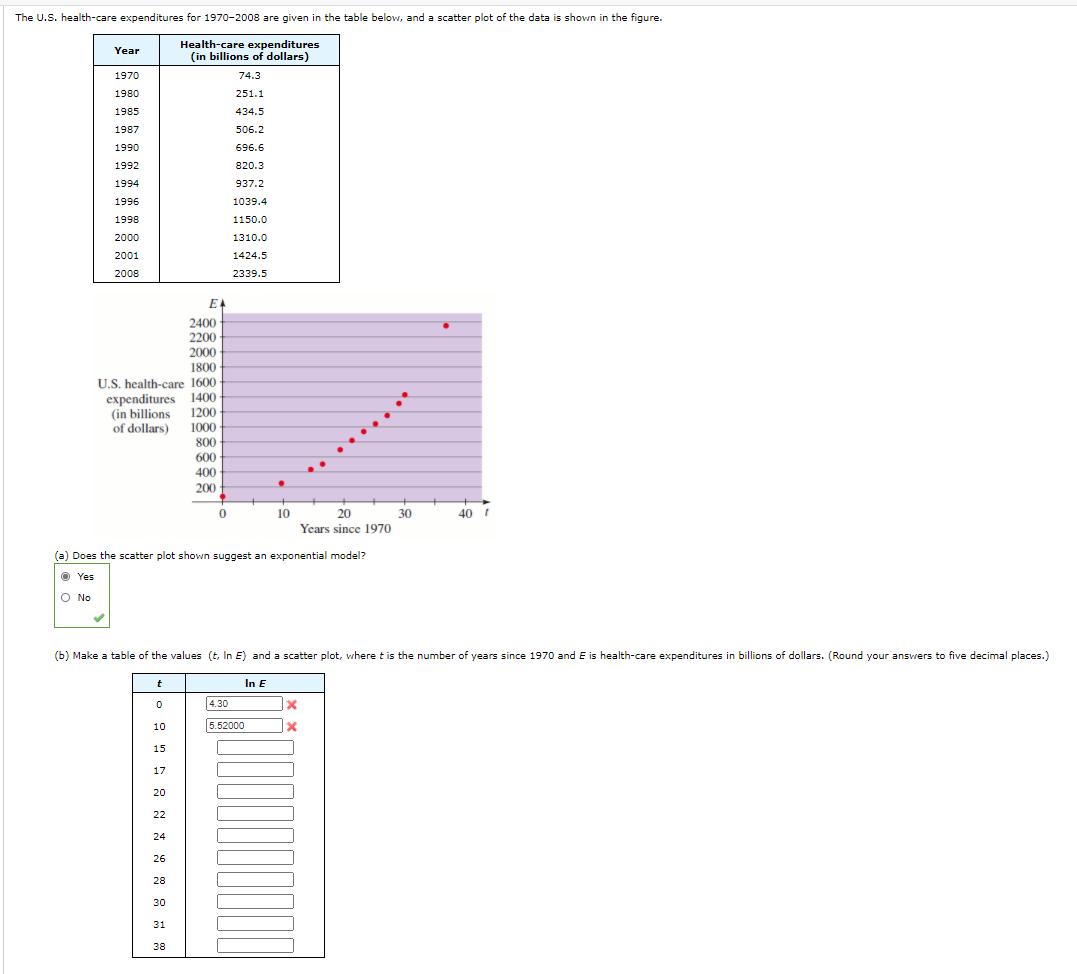
The U.S. health-care expenditures for 1970-2008 are given in the table below, and a scatter plot of the data is shown in the figure.

The U.S. health-care expenditures for 1970-2008 are given in the table below, and a scatter plot of the data is shown in the figure. Health-care expenditures (in billions of dollars) 74.3 251.1 434.5 506.2 696.6 820.3 937.2 1039.4 1150.0 1310.0 1424.5 2339.5 Year O No 1970 1980 1985 1987 1990 1992 1994 1996 1998 2000 2001 2008 2000 1800 U.S. health-care 1600 expenditures 1400 1200 1000 800 600 (in billions of dollars) t 0 10 (a) Does the scatter plot shown suggest an exponential model? Yes 15 17 20 E 2400 2200 22 24 400 200 (b) Make table of the values (t, In E) and a scatter plot, where t is the number of years since 1970 and E is health-care expenditures in billions of dollars. (Round your answers to five decimal places.) 26 28 30 31 38 0 10 In E 4.30 5.52000 20 Years since 1970 x x 30 40 T
Step by Step Solution
★★★★★
3.24 Rating (168 Votes )
There are 3 Steps involved in it
Step: 1
SOLUTION a The Scatter shot of the as an upward curve rapidly ...
Get Instant Access to Expert-Tailored Solutions
See step-by-step solutions with expert insights and AI powered tools for academic success
Step: 2

Step: 3

Ace Your Homework with AI
Get the answers you need in no time with our AI-driven, step-by-step assistance
Get Started


