Question
The velocity graph of a car is shown below. The velocity is given in feet per second and the time in seconds. LOLOLOLOBO52515 5.5

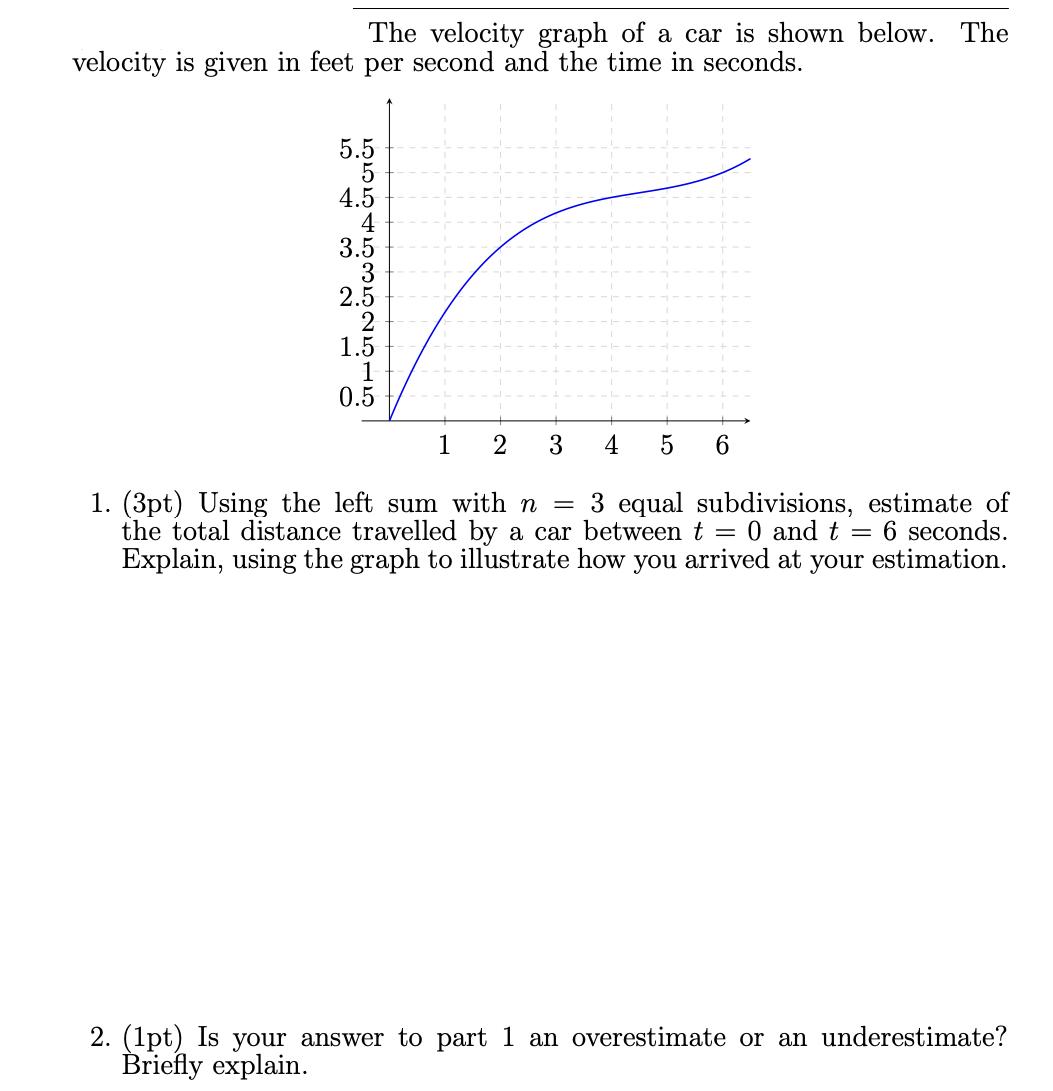
The velocity graph of a car is shown below. The velocity is given in feet per second and the time in seconds. LOLOLOLOBO52515 5.5 4.5 4 3.5 3 2.5 1.5 0.5 1 2 3 4 5 1. (3pt) Using the left sum with n= 3 equal subdivisions, estimate of the total distance travelled by a car between t = 0 and t = 6 seconds. Explain, using the graph to illustrate how you arrived at your estimation. 6 2. (1pt) Is your answer to part 1 an overestimate or an underestimate? Briefly explain.
Step by Step Solution
There are 3 Steps involved in it
Step: 1
here is an explanation of the velocity graph of the car The velocity graph of the car shows the cars velocity in feet per second over time in secondsThe graph can be divided into three sections Sectio...
Get Instant Access to Expert-Tailored Solutions
See step-by-step solutions with expert insights and AI powered tools for academic success
Step: 2

Step: 3

Ace Your Homework with AI
Get the answers you need in no time with our AI-driven, step-by-step assistance
Get StartedRecommended Textbook for
Engineering Mechanics Statics
Authors: R. C. Hibbeler
12th Edition
136077900, 978-0136077909
Students also viewed these Mathematics questions
Question
Answered: 1 week ago
Question
Answered: 1 week ago
Question
Answered: 1 week ago
Question
Answered: 1 week ago
Question
Answered: 1 week ago
Question
Answered: 1 week ago
Question
Answered: 1 week ago
Question
Answered: 1 week ago
Question
Answered: 1 week ago
Question
Answered: 1 week ago
Question
Answered: 1 week ago
Question
Answered: 1 week ago
Question
Answered: 1 week ago
Question
Answered: 1 week ago
Question
Answered: 1 week ago
Question
Answered: 1 week ago
Question
Answered: 1 week ago
Question
Answered: 1 week ago
Question
Answered: 1 week ago
Question
Answered: 1 week ago
Question
Answered: 1 week ago
Question
Answered: 1 week ago
Question
Answered: 1 week ago
View Answer in SolutionInn App


