

Answered step by step
Verified Expert Solution
Question
1 Approved Answer
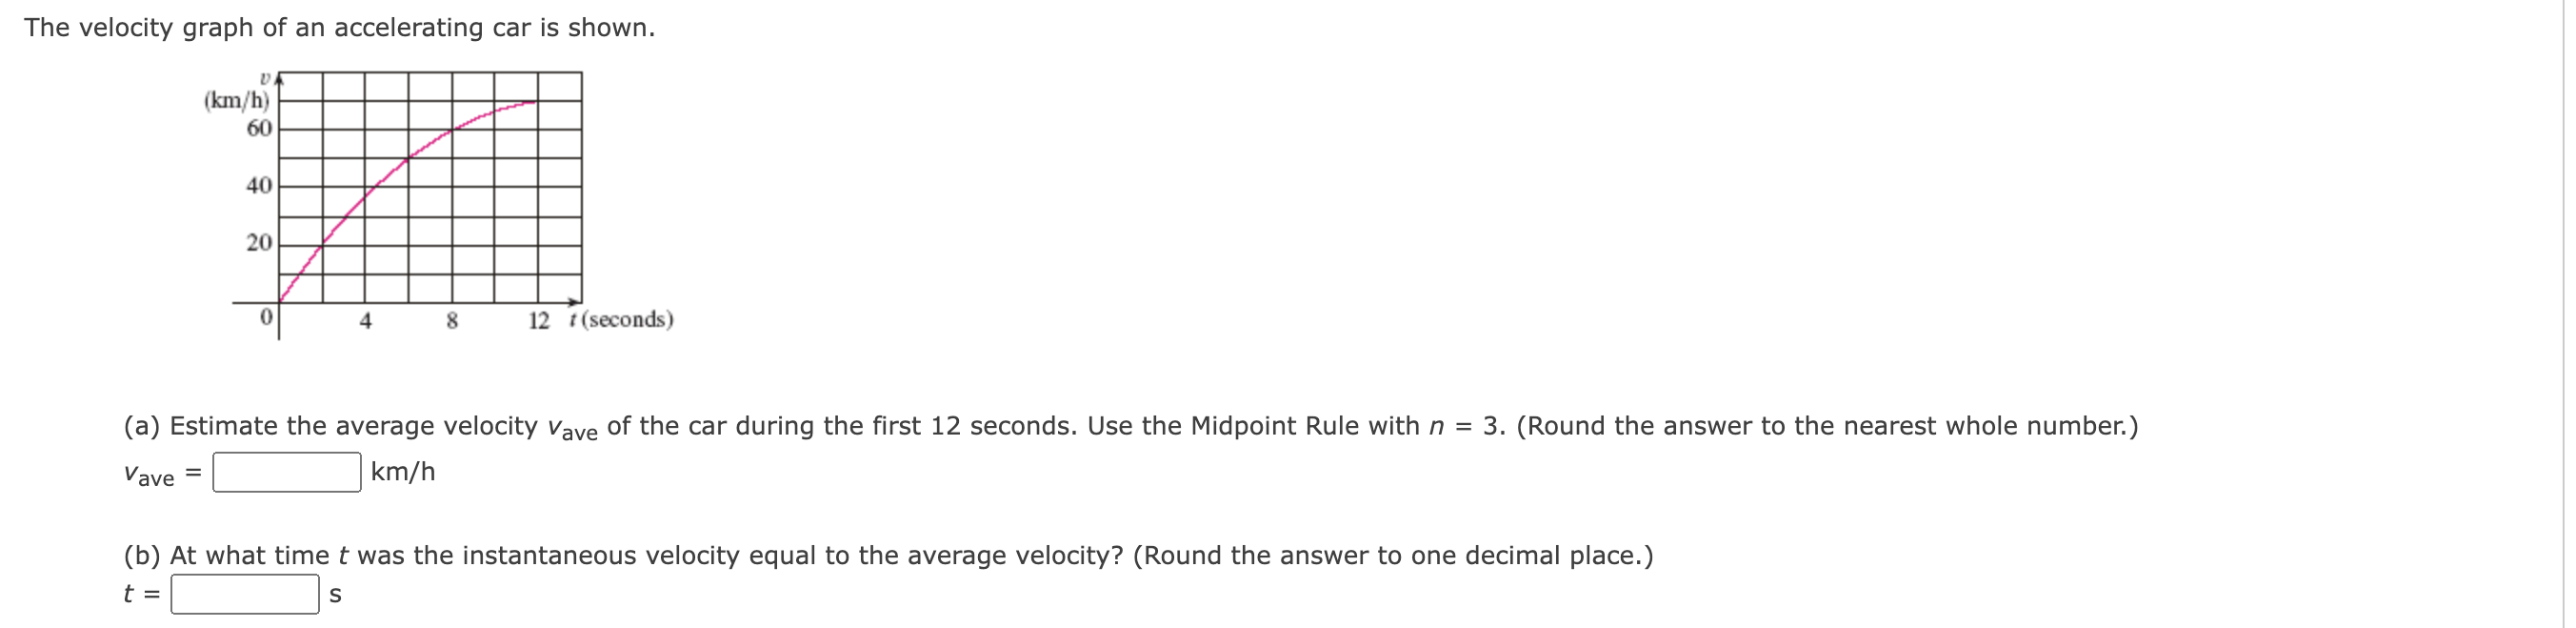
The velocity graph of an accelerating car is shown. (km/h) 60 40 20 8 12 : (seconds) (a) Estimate the average velocity Vave of the

Step by Step Solution
There are 3 Steps involved in it
Step: 1

Get Instant Access to Expert-Tailored Solutions
See step-by-step solutions with expert insights and AI powered tools for academic success
Step: 2

Step: 3
Ace Your Homework with AI
Get the answers you need in no time with our AI-driven, step-by-step assistance
Get Started
Calculus Single Variable
Authors: Deborah Hughes Hallett, Andrew M Gleason, William G McCallum
8th Edition
1119783836, 9781119783831