Question
The velocity of a bacterium undergoing one- dimensional motion is shown as a function of time in the graph to the right. A. Over

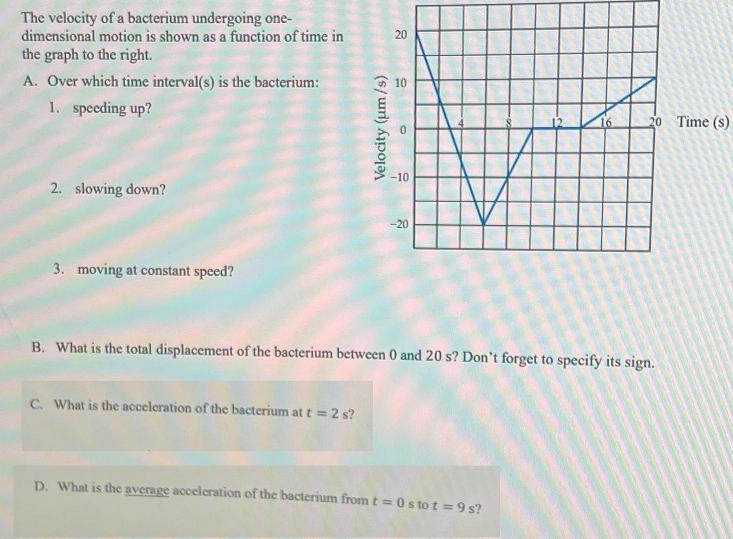
The velocity of a bacterium undergoing one- dimensional motion is shown as a function of time in the graph to the right. A. Over which time interval(s) is the bacterium: 1. speeding up? 2. slowing down? 3. moving at constant speed? Velocity (um/s) C. What is the acceleration of the bacterium at t = 2 s? 20 10 O -10 -20 B. What is the total displacement of the bacterium between 0 and 20 s? Don't forget to specify its sign. 20 Time (s) D. What is the average acceleration of the bacterium from t=0 stot = 9 s?
Step by Step Solution
There are 3 Steps involved in it
Step: 1
The image shows a velocitytime graph for a bacterium undergoing onedimensional motion Lets answer the questions based on the graph A 1 Speeding up The ...
Get Instant Access to Expert-Tailored Solutions
See step-by-step solutions with expert insights and AI powered tools for academic success
Step: 2

Step: 3

Ace Your Homework with AI
Get the answers you need in no time with our AI-driven, step-by-step assistance
Get StartedRecommended Textbook for
Matlab An Introduction with Applications
Authors: Amos Gilat
5th edition
1118629868, 978-1118801802, 1118801806, 978-1118629864
Students also viewed these Physics questions
Question
Answered: 1 week ago
Question
Answered: 1 week ago
Question
Answered: 1 week ago
Question
Answered: 1 week ago
Question
Answered: 1 week ago
Question
Answered: 1 week ago
Question
Answered: 1 week ago
Question
Answered: 1 week ago
Question
Answered: 1 week ago
Question
Answered: 1 week ago
Question
Answered: 1 week ago
Question
Answered: 1 week ago
Question
Answered: 1 week ago
Question
Answered: 1 week ago
Question
Answered: 1 week ago
Question
Answered: 1 week ago
Question
Answered: 1 week ago
Question
Answered: 1 week ago
Question
Answered: 1 week ago
Question
Answered: 1 week ago
Question
Answered: 1 week ago
Question
Answered: 1 week ago
View Answer in SolutionInn App


