

Answered step by step
Verified Expert Solution
Question
1 Approved Answer
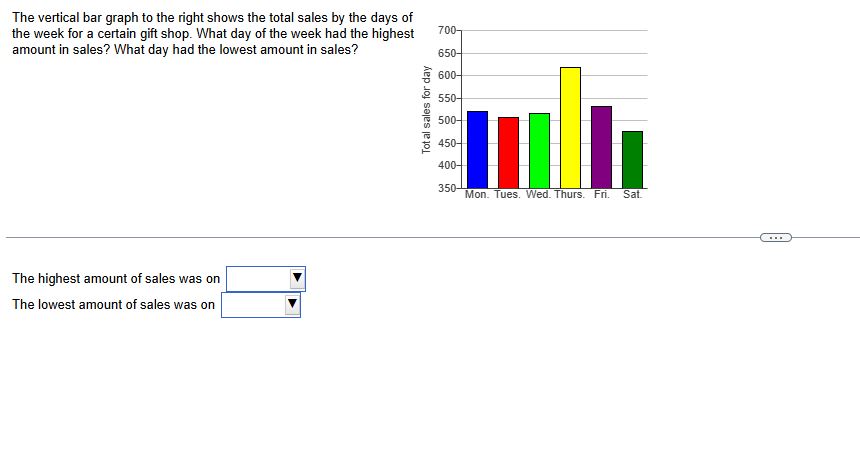
The vertical bar graph to the right shows the total sales by the days of the week for a certain gift shop. What day of
Step by Step Solution
There are 3 Steps involved in it
Step: 1

Get Instant Access to Expert-Tailored Solutions
See step-by-step solutions with expert insights and AI powered tools for academic success
Step: 2

Step: 3
Ace Your Homework with AI
Get the answers you need in no time with our AI-driven, step-by-step assistance
Get Started
An Introduction to Measure Theoretic Probability
Authors: George G. Roussas
2nd edition
128000422, 978-0128000427