Answered step by step
Verified Expert Solution
Question
1 Approved Answer
The video is illustrated by the pictures above. MTRE 2610 Engineering Algorithms and Visualization Dr. Kevin McFall Laboratory - Tracking in 2D Introduction The goal


The video is illustrated by the pictures above.
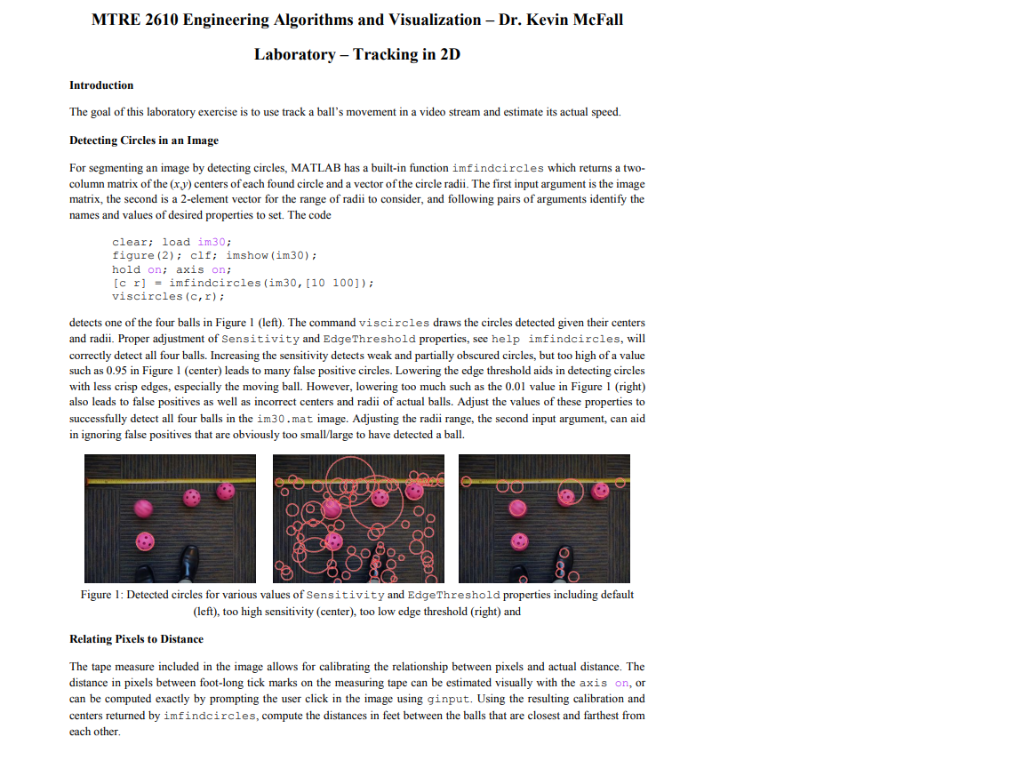
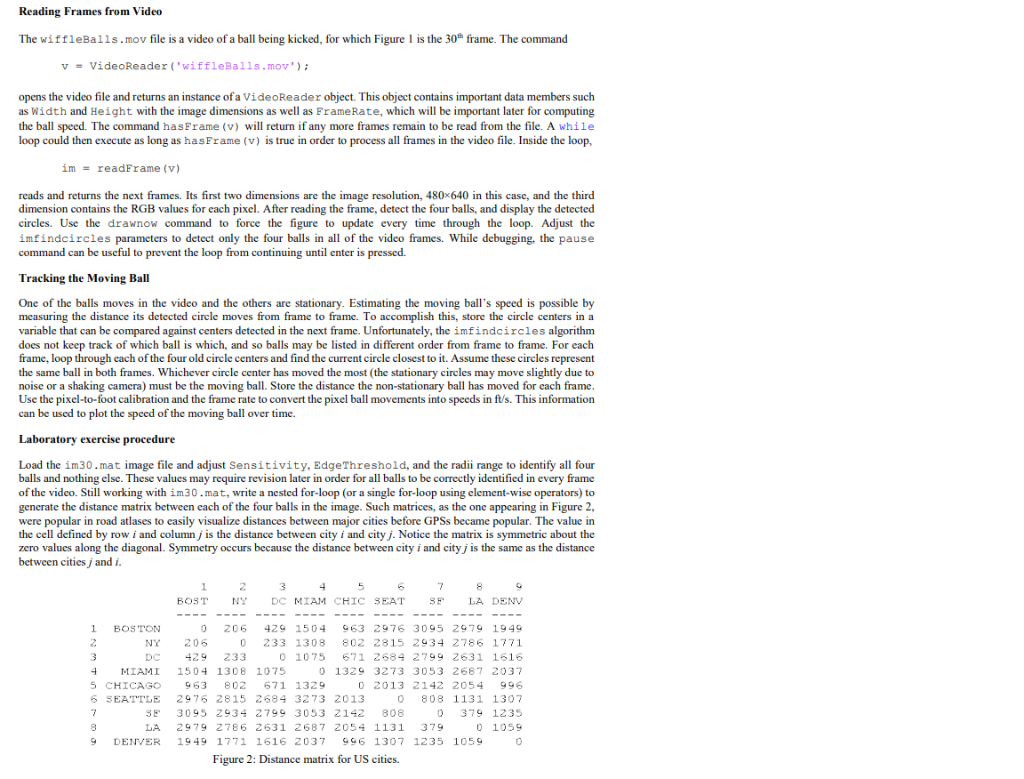
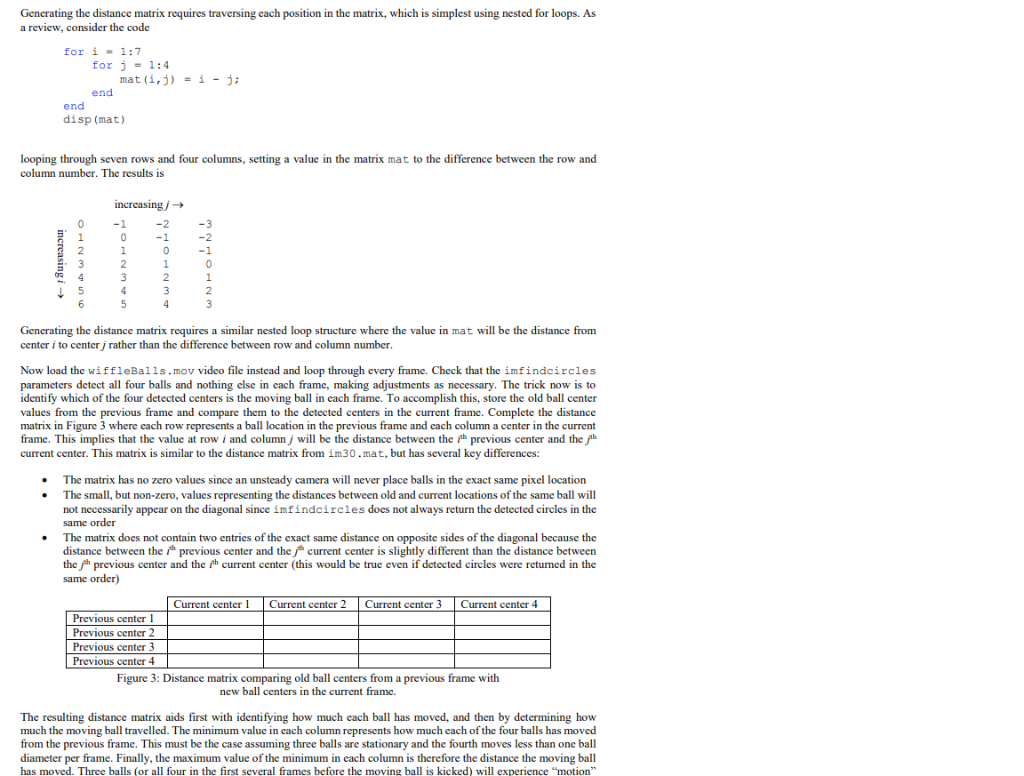
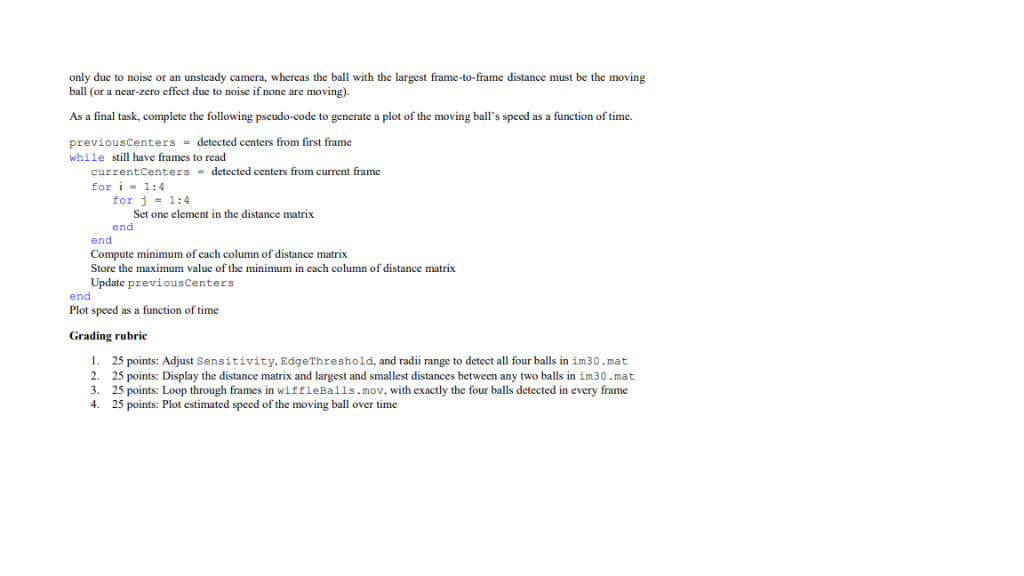
MTRE 2610 Engineering Algorithms and Visualization Dr. Kevin McFall Laboratory - Tracking in 2D Introduction The goal of this laboratory exercise is to use track a ball's movement in a video stream and estimate its actual speed Detecting Circles in an Image For segmenting an image by detecting circles, MATLAB has a built-in function imfindcircles which returns a two- column matrix of the (xy) centers of each found circle and a vector of the circle radii. The first input argument is the image matrix, the second is a 2-element vector for the range of radii to consider, and following pairs of arguments identify the names and values of desired properties to set. The code clear: load im30 figure (2): clf: imshow (im30) hold on; axis on; cr imfindcircles (im30, 10 100]) viscircles (c,r) detects one of the four balls in Figure 1 (left). The command viscircles draws the circles detected given their centers and radii. Proper adjustment of Sensitivity and EdgeThreshold properties, see help imfindcircles, will correctly detect all four balls. Increasing the sensitivity detects weak and partially obscured circles, but too high of a value such as 0.95 in Figure (center) leads to many false positive circles. Lowering the edge threshold aids in detecting circles with less crisp edges, especially the moving ball. However, lowering too much such as the 0.01 value in Figure (right) also leads to false positives as well as incorrect centers and radii of actual balls. Adjust the values of these properties to successfully detect all four balls in the im30 . mat image. Adjusting the radii range the second input argument can aid in ignoring false positives that are obviously too smalMarge to have detected a ball. O. Figure 1: Detected circles for various values of Sensitivity and EdgeThreshold properties including default (left), too high sensitivity (center), too low edge threshold (right) and Relating Pixels to Distance The tape measure included in the image allows for calibrating the relationship between pixels and actual distance. The distance in pixels between foot-long tick marks on the measuring tape can be estimated visually with the axis on, or can be computed exactly by prompting the user click in the image using ginput. Using the resulting calibration and centers returned by imfindcircles, compute the distances in feet between the balls that are closest and farthest from each other Reading Frames from Video The wiffleBalls.mov file is a video of a ball being kicked, for which Figure is the 30h frame. The command v-VideoReader ('wiffleBalls.mov opens the video file and returns an instance of a VideoReader object. This object contains important data members such as Width and Height with the image dimensions as well as FrameRate, which will be important later for computing the ball speed. The command hasFrame (v) will return if any more frames remain to be read from the file. A while loop could then execute as long as hasFrame (v) is true in order to process all frames in the video file. Inside the loop, imreadFrame (v) reads and returns the next frames. Its first two dimensions are the image resolution, 480x640 in this case, and the third dimension contains the RGB values for each pixel. After reading the frame, detect the four balls, and display the detected circles. Use the drawnow command to force the figure to update every time through the loop. Adjust the imfindcircles parameters to detect only the four balls in all of the video frames. While debugging, the pause command can be useful to prevent the loop from continuing until enter is pressed Tracking the Moving Ball One of the balls moves in the video and the others are stationary. Estimating the moving ball's speed is possible by measuring the distance its detected circle moves from frame to frame. To accomplish this, store the circle centers in a variable that can be compared against centers detected in the next frame. Unfortunately, the imfindcircles algorithm does not keep track of which ball is which, and so balls may be listed in different order from frame to frame. For each frame, loop through each of the four old circele centers and find the current circle closest to it. Assume these circles represent the same ball in both frames. Whichever circle center has moved the most (the stationary circles may move slightly due to noise or a shaking camera) must be the moving ball. Store the distance the non-stationary ball has moved for each frame. Use the pixel-to-foot calibration and the frame rate to convert the pixel ball movements into speeds in fts. This information can be used to plot the speed of the moving ball over time. Laboratory exercise procedure Load the im30.mat image file and adjust Sensitivity, EdgeThreshold, and the radii range to identify all four balls and nothing else. These values may require revision later in order for all balls to be correctly identified in every frame of the video. Still working with im30.mat, write a nested for-loop (or a single for-loop using element-wise opcrators) to generate the distance matrix between each of the four balls in the image. Such matrices, as the one appearing in Figure 2 were popular in road atlases to easily visualize distances between major cities before GPSs became popular. The value in the cell defined by row i and column j is the distance between city i and city j. Notice the matrix is symmetric about the zero values along the diagonal. Symmetry occurs because the distance between city i and cityj is the same as the distance between cities j andi. 2 BOST NYDC MIAM CHIC SEAT SF LA DENV 1 BOS TON 0 206 429 1504 963 2976 3095 2979 1949 0 233 1308 802 2815 2934 2786 1771 0 1075 671 2684 2799 2631 1616 0 1329 3273 3053 2687 2037 0 2013 2142 2054 996 0 808 1131 1307 0 379 1235 0 1059 0 NY 206 DC 429 233 MIAMI1504 1308 1075 5 CHICAGO 963 802 671 1329 6 SEATTLE 2976 2815 2684 3273 2013 SE 3095 2934 2799 3053 2142 808 LA 2979 2786 2631 2687 2054 1131 379 DENVER1949 1771 1616 2037 996 1307 1235 1059 Figure 2: Distance matrix for US cities. Generating the distance matrix requires traversing each position in the matrix, which is simplest using nested for loops. As a review, consider the code for i-1:7 for j-1:4 mat(i,j)-i-j; end end disp (mat) looping through seven rows and four columns, setting a value in the matrix mat to the difference between the row and column number. The results is increasing j 0-1-23 Gencrating the distance matrix requires a similar nested loop structure where the value in mat will be the distance from center i to center j rather than the difference between row and column number Now load the wiffleBalls.mov video file instead and loop through every frame. Check that the imfindcircles parameters detect all four balls and nothing else in each frame, making adjustments as necessary. The trick now is to identify which of the four detected centers is the moving ball in each frame. To accomplish this, store the old ball center values from the previous frame and compare them to the detected centers in the current frame. Complete the distance matrix in Figure 3 where each row represents a ball location in the previous frame and cach column a center in the current frame. This implies that the value at row i and column, will be the distance between the ith previous center and the current center. This matrix is similar to the distance matrix from im30.mat, but has several key differences: .The matrix has no zero values since an unsteady camera will never place balls in the exact same pixel location The small, but non-zero, values representing the distances between old and current locations of the same ball will not necessarily appear on the diagonal since imfindcircles does not always return the detected circles in the same order .The matrix does not contain two entries of the exact same distance on opposite sides of the diagonal because the distance between the previous center and the current center is slightly different than the distance between the previous center and the ith current center (this would be true even if detected circles were returned in the same order) Current center Current center 2 Current center 3 Current center 4 Previous center Previous center 2 Previous center Previous center 4 Figure 3: Distance matrix comparing old ball centers from a previous frame with new ball centers in the current framc. The resulting distance matrix aids first with identifying how much each ball has moved, and then by determining how much the moving ball travelled. The minimum valuc in cach column represents how much each of the four balls has moved from the previous diameter per frame. Finally, the maximum value of the minimum in each column is therefore the distance the moving has moved. Three balls (or all four in the first several frames before the moving ball is kicked) will experience "motion frame. This must be the case assuming three balls are stationary and the fourth moves less than one ball ball only due to noise or an unsteady camera, whereas the ball with the largest frame-to-frame distance must be the moving ball (or a near-zero effect duc to noise if none are moving) As a final task, complete the following pseudo-code to generate a plot of the moving ball's speed as a function of time. previousCenters-detected centers from first frame while still have frames to read currentCenters-detected centers from current frame for i-1:4 for j-1:4 Set one element in the distance matrix end end Compute minimum of each column of distance matrix Store the maximum valuc of the minimum in each column of distance matrix Update previousCenters end Plot speed as a function of time Grading rubric 25 points: Adjust Sensitivity, EdgeThreshold, and radii range to detect all four balls in im30.mat 2. 25 points: Display the distance matrix and largest and smallest distances between any two balls in im30.mat 3. 25 points: Loop through frames in wiffleBalls.mov, with exactly the four balls detected in every frame 4. 25 points: Plot estimated speed of the moving ball over time MTRE 2610 Engineering Algorithms and Visualization Dr. Kevin McFall Laboratory - Tracking in 2D Introduction The goal of this laboratory exercise is to use track a ball's movement in a video stream and estimate its actual speed Detecting Circles in an Image For segmenting an image by detecting circles, MATLAB has a built-in function imfindcircles which returns a two- column matrix of the (xy) centers of each found circle and a vector of the circle radii. The first input argument is the image matrix, the second is a 2-element vector for the range of radii to consider, and following pairs of arguments identify the names and values of desired properties to set. The code clear: load im30 figure (2): clf: imshow (im30) hold on; axis on; cr imfindcircles (im30, 10 100]) viscircles (c,r) detects one of the four balls in Figure 1 (left). The command viscircles draws the circles detected given their centers and radii. Proper adjustment of Sensitivity and EdgeThreshold properties, see help imfindcircles, will correctly detect all four balls. Increasing the sensitivity detects weak and partially obscured circles, but too high of a value such as 0.95 in Figure (center) leads to many false positive circles. Lowering the edge threshold aids in detecting circles with less crisp edges, especially the moving ball. However, lowering too much such as the 0.01 value in Figure (right) also leads to false positives as well as incorrect centers and radii of actual balls. Adjust the values of these properties to successfully detect all four balls in the im30 . mat image. Adjusting the radii range the second input argument can aid in ignoring false positives that are obviously too smalMarge to have detected a ball. O. Figure 1: Detected circles for various values of Sensitivity and EdgeThreshold properties including default (left), too high sensitivity (center), too low edge threshold (right) and Relating Pixels to Distance The tape measure included in the image allows for calibrating the relationship between pixels and actual distance. The distance in pixels between foot-long tick marks on the measuring tape can be estimated visually with the axis on, or can be computed exactly by prompting the user click in the image using ginput. Using the resulting calibration and centers returned by imfindcircles, compute the distances in feet between the balls that are closest and farthest from each other Reading Frames from Video The wiffleBalls.mov file is a video of a ball being kicked, for which Figure is the 30h frame. The command v-VideoReader ('wiffleBalls.mov opens the video file and returns an instance of a VideoReader object. This object contains important data members such as Width and Height with the image dimensions as well as FrameRate, which will be important later for computing the ball speed. The command hasFrame (v) will return if any more frames remain to be read from the file. A while loop could then execute as long as hasFrame (v) is true in order to process all frames in the video file. Inside the loop, imreadFrame (v) reads and returns the next frames. Its first two dimensions are the image resolution, 480x640 in this case, and the third dimension contains the RGB values for each pixel. After reading the frame, detect the four balls, and display the detected circles. Use the drawnow command to force the figure to update every time through the loop. Adjust the imfindcircles parameters to detect only the four balls in all of the video frames. While debugging, the pause command can be useful to prevent the loop from continuing until enter is pressed Tracking the Moving Ball One of the balls moves in the video and the others are stationary. Estimating the moving ball's speed is possible by measuring the distance its detected circle moves from frame to frame. To accomplish this, store the circle centers in a variable that can be compared against centers detected in the next frame. Unfortunately, the imfindcircles algorithm does not keep track of which ball is which, and so balls may be listed in different order from frame to frame. For each frame, loop through each of the four old circele centers and find the current circle closest to it. Assume these circles represent the same ball in both frames. Whichever circle center has moved the most (the stationary circles may move slightly due to noise or a shaking camera) must be the moving ball. Store the distance the non-stationary ball has moved for each frame. Use the pixel-to-foot calibration and the frame rate to convert the pixel ball movements into speeds in fts. This information can be used to plot the speed of the moving ball over time. Laboratory exercise procedure Load the im30.mat image file and adjust Sensitivity, EdgeThreshold, and the radii range to identify all four balls and nothing else. These values may require revision later in order for all balls to be correctly identified in every frame of the video. Still working with im30.mat, write a nested for-loop (or a single for-loop using element-wise opcrators) to generate the distance matrix between each of the four balls in the image. Such matrices, as the one appearing in Figure 2 were popular in road atlases to easily visualize distances between major cities before GPSs became popular. The value in the cell defined by row i and column j is the distance between city i and city j. Notice the matrix is symmetric about the zero values along the diagonal. Symmetry occurs because the distance between city i and cityj is the same as the distance between cities j andi. 2 BOST NYDC MIAM CHIC SEAT SF LA DENV 1 BOS TON 0 206 429 1504 963 2976 3095 2979 1949 0 233 1308 802 2815 2934 2786 1771 0 1075 671 2684 2799 2631 1616 0 1329 3273 3053 2687 2037 0 2013 2142 2054 996 0 808 1131 1307 0 379 1235 0 1059 0 NY 206 DC 429 233 MIAMI1504 1308 1075 5 CHICAGO 963 802 671 1329 6 SEATTLE 2976 2815 2684 3273 2013 SE 3095 2934 2799 3053 2142 808 LA 2979 2786 2631 2687 2054 1131 379 DENVER1949 1771 1616 2037 996 1307 1235 1059 Figure 2: Distance matrix for US cities. Generating the distance matrix requires traversing each position in the matrix, which is simplest using nested for loops. As a review, consider the code for i-1:7 for j-1:4 mat(i,j)-i-j; end end disp (mat) looping through seven rows and four columns, setting a value in the matrix mat to the difference between the row and column number. The results is increasing j 0-1-23 Gencrating the distance matrix requires a similar nested loop structure where the value in mat will be the distance from center i to center j rather than the difference between row and column number Now load the wiffleBalls.mov video file instead and loop through every frame. Check that the imfindcircles parameters detect all four balls and nothing else in each frame, making adjustments as necessary. The trick now is to identify which of the four detected centers is the moving ball in each frame. To accomplish this, store the old ball center values from the previous frame and compare them to the detected centers in the current frame. Complete the distance matrix in Figure 3 where each row represents a ball location in the previous frame and cach column a center in the current frame. This implies that the value at row i and column, will be the distance between the ith previous center and the current center. This matrix is similar to the distance matrix from im30.mat, but has several key differences: .The matrix has no zero values since an unsteady camera will never place balls in the exact same pixel location The small, but non-zero, values representing the distances between old and current locations of the same ball will not necessarily appear on the diagonal since imfindcircles does not always return the detected circles in the same order .The matrix does not contain two entries of the exact same distance on opposite sides of the diagonal because the distance between the previous center and the current center is slightly different than the distance between the previous center and the ith current center (this would be true even if detected circles were returned in the same order) Current center Current center 2 Current center 3 Current center 4 Previous center Previous center 2 Previous center Previous center 4 Figure 3: Distance matrix comparing old ball centers from a previous frame with new ball centers in the current framc. The resulting distance matrix aids first with identifying how much each ball has moved, and then by determining how much the moving ball travelled. The minimum valuc in cach column represents how much each of the four balls has moved from the previous diameter per frame. Finally, the maximum value of the minimum in each column is therefore the distance the moving has moved. Three balls (or all four in the first several frames before the moving ball is kicked) will experience "motion frame. This must be the case assuming three balls are stationary and the fourth moves less than one ball ball only due to noise or an unsteady camera, whereas the ball with the largest frame-to-frame distance must be the moving ball (or a near-zero effect duc to noise if none are moving) As a final task, complete the following pseudo-code to generate a plot of the moving ball's speed as a function of time. previousCenters-detected centers from first frame while still have frames to read currentCenters-detected centers from current frame for i-1:4 for j-1:4 Set one element in the distance matrix end end Compute minimum of each column of distance matrix Store the maximum valuc of the minimum in each column of distance matrix Update previousCenters end Plot speed as a function of time Grading rubric 25 points: Adjust Sensitivity, EdgeThreshold, and radii range to detect all four balls in im30.mat 2. 25 points: Display the distance matrix and largest and smallest distances between any two balls in im30.mat 3. 25 points: Loop through frames in wiffleBalls.mov, with exactly the four balls detected in every frame 4. 25 points: Plot estimated speed of the moving ball over timeStep by Step Solution
There are 3 Steps involved in it
Step: 1

Get Instant Access to Expert-Tailored Solutions
See step-by-step solutions with expert insights and AI powered tools for academic success
Step: 2

Step: 3

Ace Your Homework with AI
Get the answers you need in no time with our AI-driven, step-by-step assistance
Get Started


