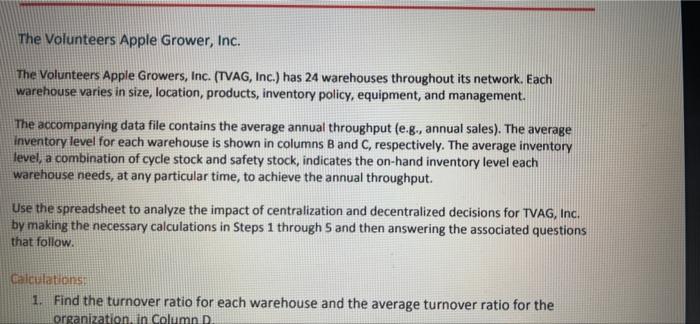
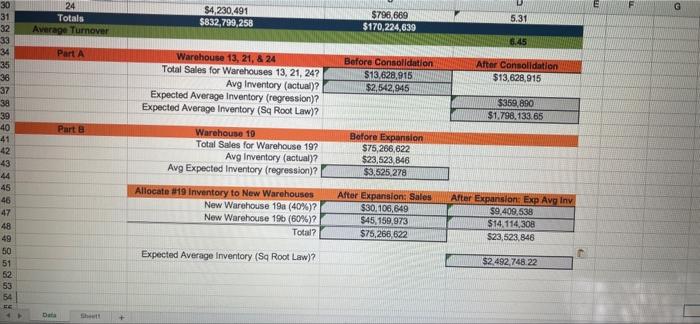
The Volunteers Apple Grower, Inc. The Volunteers Apple Growers, Inc. (TVAG, Inc.) has 24 warehouses throughout its network. Each warehouse varies in size, location, products, inventory policy, equipment, and management. The accompanying data file contains the average annual throughput (e.g., annual sales). The average inventory level for each warehouse is shown in columns B and C, respectively. The average inventory level, a combination of cycle stock and safety stock, indicates the on-hand inventory level each warehouse needs, at any particular time, to achieve the annual throughput. Use the spreadsheet to analyze the impact of centralization and decentralized decisions for TVAG, Inc. by making the necessary calculations in Steps 1 through S and then answering the associated questions that follow. Calculations 1. Find the turnover ratio for each warehouse and the average turnover ratio for the organization in Column D. F G 24 Totals Average Turnover $4,230,491 $832,799,258 $796,669 $170,224,639 5.31 6.45 33 34 Part A Before Consolidation $13,628,915 $2.542,945 After Consolidation $13,628,915 38 37 38 39 Warehouse 13, 21, & 24 Total Sales for Warehouses 13, 21, 247 Avg Inventory (actual)? Expected Average Inventory (regression)? Expected Average Inventory (Sq Root Law)? Warehouse 10 Total Sales for Warehouse 197 Avg Inventory (actual)? Avg Expected Inventory (regression)? $359,800 $1.798.133.65 Part @ RX886&&&&8889&&&8898 Before Expansion $75,266,622 $23,523,846 $3.525,278 42 43 44 45 46 47 48 49 50 51 52 53 54 Allocate #19 Inventory to New Warehouses New Warehouse 19a (40%)? New Warehouse 196 (60%)2 Total? After Expansion: Sales $30,106,649 $45,159,973 $75,266,622 After Expansion: Exp Avg Inv $9.409,538 $14.114,308 $23,523,846 Expected Average Inventory (Sq Root Law)? $2492,748.22 Data ht Think about and explain how a centralized network with fewer warehouses and a decentralized network with more warehouses impacts both customer service and inventory carrying cost for the supply chain. Using the data from the calculations above, briefly answer each of the questions below: 1. (5 points) Based on the turn-over ratio, what observations can you make? Which warehouses require a more in-depth analysis? 2. (10 points) Based on the regression model, what observation can you make? How might the use of actual data affect centralization or decentralization decisions for this network? 3. (15 points) Based on your calculations in Part A, answer the following questions: a. Why were Warehouses 13, 21, and 24 selected for consolidation? b. Should Warehouse 8 have been included in the consolidation? Why or why not? C. Is the average inventory level after consolidation what you would expect to see from consolidation? d. Which estimate of the average inventory level, the regression model or the Square Root Law, would be a better predictor for the impact of centralization for this network? Why? e. How does a centralized network with fewer warehouses impact both customer service and inventory carrying costs for the supply chain? (15 points) Based on your calculations in Part B, answer the following questions: a. Are the calculations for the expected average inventory levels for 19a and 19b what you would expect? Why or why not? b. How does the total expected inventory level of the 2-warehouse system compare with the baseline for Warehouse 19 (before decentralization)? What might account for the difference? C. How does the total expected inventory level of the 2-warehouse system compare with the Square Root Law calculation? What might account for the difference? d. How does a decentralized network with more warehouses impact both customer service and inventory carrying costs for the supply chain? 5. (5 points) What are the advantages and disadvantages of using the square root heuristic compared to using actual data? The Volunteers Apple Grower, Inc. The Volunteers Apple Growers, Inc. (TVAG, Inc.) has 24 warehouses throughout its network. Each warehouse varies in size, location, products, inventory policy, equipment, and management. The accompanying data file contains the average annual throughput (e.g., annual sales). The average inventory level for each warehouse is shown in columns B and C, respectively. The average inventory level, a combination of cycle stock and safety stock, indicates the on-hand inventory level each warehouse needs, at any particular time, to achieve the annual throughput. Use the spreadsheet to analyze the impact of centralization and decentralized decisions for TVAG, Inc. by making the necessary calculations in Steps 1 through S and then answering the associated questions that follow. Calculations 1. Find the turnover ratio for each warehouse and the average turnover ratio for the organization in Column D. F G 24 Totals Average Turnover $4,230,491 $832,799,258 $796,669 $170,224,639 5.31 6.45 33 34 Part A Before Consolidation $13,628,915 $2.542,945 After Consolidation $13,628,915 38 37 38 39 Warehouse 13, 21, & 24 Total Sales for Warehouses 13, 21, 247 Avg Inventory (actual)? Expected Average Inventory (regression)? Expected Average Inventory (Sq Root Law)? Warehouse 10 Total Sales for Warehouse 197 Avg Inventory (actual)? Avg Expected Inventory (regression)? $359,800 $1.798.133.65 Part @ RX886&&&&8889&&&8898 Before Expansion $75,266,622 $23,523,846 $3.525,278 42 43 44 45 46 47 48 49 50 51 52 53 54 Allocate #19 Inventory to New Warehouses New Warehouse 19a (40%)? New Warehouse 196 (60%)2 Total? After Expansion: Sales $30,106,649 $45,159,973 $75,266,622 After Expansion: Exp Avg Inv $9.409,538 $14.114,308 $23,523,846 Expected Average Inventory (Sq Root Law)? $2492,748.22 Data ht Think about and explain how a centralized network with fewer warehouses and a decentralized network with more warehouses impacts both customer service and inventory carrying cost for the supply chain. Using the data from the calculations above, briefly answer each of the questions below: 1. (5 points) Based on the turn-over ratio, what observations can you make? Which warehouses require a more in-depth analysis? 2. (10 points) Based on the regression model, what observation can you make? How might the use of actual data affect centralization or decentralization decisions for this network? 3. (15 points) Based on your calculations in Part A, answer the following questions: a. Why were Warehouses 13, 21, and 24 selected for consolidation? b. Should Warehouse 8 have been included in the consolidation? Why or why not? C. Is the average inventory level after consolidation what you would expect to see from consolidation? d. Which estimate of the average inventory level, the regression model or the Square Root Law, would be a better predictor for the impact of centralization for this network? Why? e. How does a centralized network with fewer warehouses impact both customer service and inventory carrying costs for the supply chain? (15 points) Based on your calculations in Part B, answer the following questions: a. Are the calculations for the expected average inventory levels for 19a and 19b what you would expect? Why or why not? b. How does the total expected inventory level of the 2-warehouse system compare with the baseline for Warehouse 19 (before decentralization)? What might account for the difference? C. How does the total expected inventory level of the 2-warehouse system compare with the Square Root Law calculation? What might account for the difference? d. How does a decentralized network with more warehouses impact both customer service and inventory carrying costs for the supply chain? 5. (5 points) What are the advantages and disadvantages of using the square root heuristic compared to using actual data