

Question
The years at the top are 2012/2013/2014/2015 please help me with the part B questions below Part B: Scenario Analysis 1. Contraction. Assume increased competition
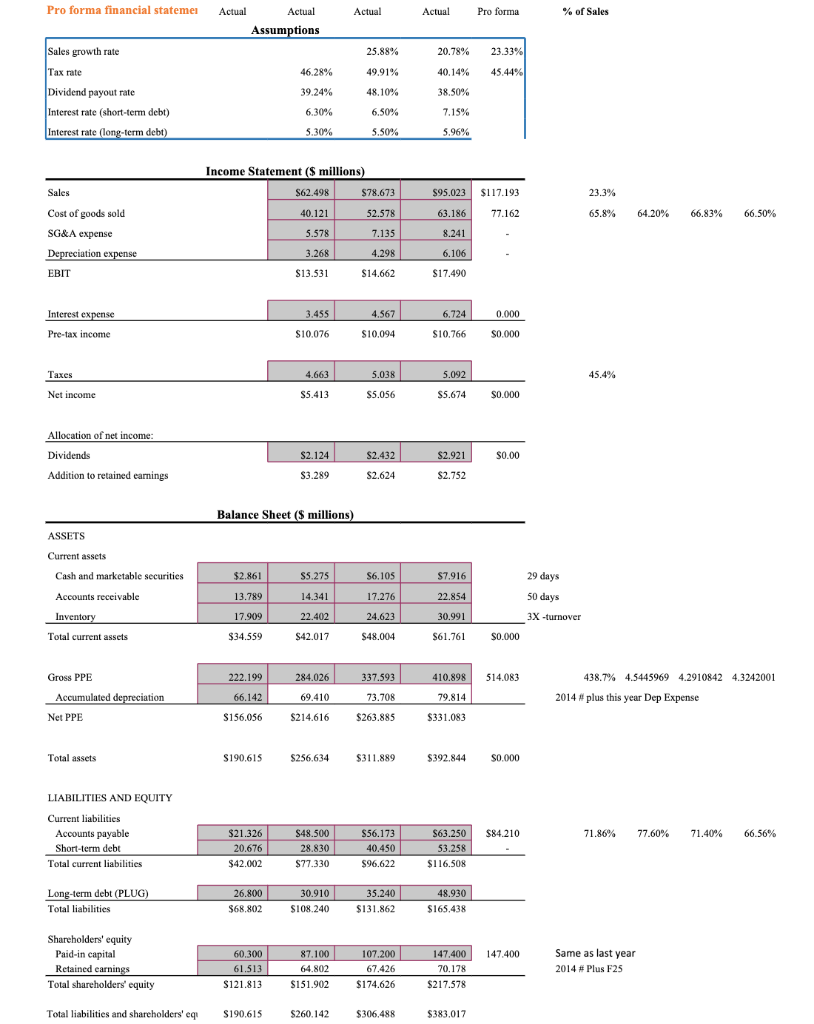
The years at the top are 2012/2013/2014/2015
please help me with the part B questions below
Part B: Scenario Analysis 1. Contraction. Assume increased competition and a depressed economy limits sales growth to 7% in 2015. In addition, rising interest rates push the rate on short-term debt to 9.5%. Also, rising costs lower gross margins, pushing COGS/Sales to 68.5%.
Q3: Under the contraction scenario, what level of long-term debt will be required in 2015?
Q4: What is projected net income? 2. High growth. Unexpected demand pushes sales growth to 30% in 2015. Because some costs are fixed, SG&A/Sales drops to 7.5%. Also, much of the sales growth is supported by existing excess capacity, so PPE/Sales is projected to be only 425%. COGS/Sales returns to its initial level (average of previous 3 years). The interest rate on short-term debt returns to its initial level.
Q5: Under the high-growth scenario, what level of long-term debt will be required in 2015?
Q6: What is projected net income?
Pro forma financial statemen Sales growth rate Tax rate Dividend payout rate. Interest rate (short-term debt) Interest rate (long-term debt) Sales Cost of goods sold SG&A expense Depreciation expense EBIT Interest expense Pre-tax income Taxes Net income Allocation of net income: Dividends Addition to retained earnings ASSETS Current assets Cash and marketable securities Accounts receivable Inventory Total current assets Gross PPE Accumulated depreciation Net PPE Total assets LIABILITIES AND EQUITY Current liabilities Accounts payable Short-term debt Total current liabilities Long-term debt (PLUG) Total liabilities Shareholders' equity Paid-in capital Retained earnings Total shareholders' equity Total liabilities and shareholders' equ Actual Actual Assumptions Actual 25.88% 49.91% 48.10% 6.50% 5.50% 46.28% 39.24% 6.30% 5.30% Income Statement ($ millions) $62.498 40.121 5.578 3.268 $13.531 3.455 $10,076 4.663 $5.413 $2.124 $3.289 Balance Sheet ($ millions) $2.861 $5.275 $6.105 13.789 14.341 17.276 17.909 22.402 24.623 $34.559 $42.017 $48.004 222.199 284.026 337.593 66.142 69.410 73.708 $156.056 $214.616 $263.885 $190.615 $256.634 $311,889 $21.326 $48.500 $56.173 20.676 28.830 40,450 $42.002 $77.330 $96.622 26.800 30.910 35.240 $68,802 $108.240 $131.862 87.100 107.200 60.300 61.513 64.802 67.426 $121.813 $151.902 $174.626 $190.615 $260.142 $306.488 $78.673 52.578 7.135 4.298 $14.662 4.567 $10.094 5.038 $5.056 $2.432 $2.624 Pro forma 20.78% 23.33% 40.14% 45.44% 38.50% 7.15% 5.96% $95.023 $117.193 63.186 77.162 8.241 6.106 $17.490 6.724 0.000 $10,766 $0.000 5.092 $5.674 $0.000 $2.921 $0.00 $2.752 $7.916 22.854 30.991 $61.761 $0.000 410.898 514.083 79.814 $331.083 $392,844 $0.000 $63.250 $84.210 53.258 $116.508 48.930 $165.438 147.400 70,178 $217.578 $383.017 Actual 147.400 % of Sales 29 days 50 days 3X -turnover 23.3% 65.8% 45.4% 64.20% 66.83% Same as last year 2014 # Plus F25 438.7% 4.5445969 4.2910842 4.3242001 71.86% 77.60% 71.40% 66.56% 2014 # plus this year Dep Expense 66.50% Pro forma financial statemen Sales growth rate Tax rate Dividend payout rate. Interest rate (short-term debt) Interest rate (long-term debt) Sales Cost of goods sold SG&A expense Depreciation expense EBIT Interest expense Pre-tax income Taxes Net income Allocation of net income: Dividends Addition to retained earnings ASSETS Current assets Cash and marketable securities Accounts receivable Inventory Total current assets Gross PPE Accumulated depreciation Net PPE Total assets LIABILITIES AND EQUITY Current liabilities Accounts payable Short-term debt Total current liabilities Long-term debt (PLUG) Total liabilities Shareholders' equity Paid-in capital Retained earnings Total shareholders' equity Total liabilities and shareholders' equ Actual Actual Assumptions Actual 25.88% 49.91% 48.10% 6.50% 5.50% 46.28% 39.24% 6.30% 5.30% Income Statement ($ millions) $62.498 40.121 5.578 3.268 $13.531 3.455 $10,076 4.663 $5.413 $2.124 $3.289 Balance Sheet ($ millions) $2.861 $5.275 $6.105 13.789 14.341 17.276 17.909 22.402 24.623 $34.559 $42.017 $48.004 222.199 284.026 337.593 66.142 69.410 73.708 $156.056 $214.616 $263.885 $190.615 $256.634 $311,889 $21.326 $48.500 $56.173 20.676 28.830 40,450 $42.002 $77.330 $96.622 26.800 30.910 35.240 $68,802 $108.240 $131.862 87.100 107.200 60.300 61.513 64.802 67.426 $121.813 $151.902 $174.626 $190.615 $260.142 $306.488 $78.673 52.578 7.135 4.298 $14.662 4.567 $10.094 5.038 $5.056 $2.432 $2.624 Pro forma 20.78% 23.33% 40.14% 45.44% 38.50% 7.15% 5.96% $95.023 $117.193 63.186 77.162 8.241 6.106 $17.490 6.724 0.000 $10,766 $0.000 5.092 $5.674 $0.000 $2.921 $0.00 $2.752 $7.916 22.854 30.991 $61.761 $0.000 410.898 514.083 79.814 $331.083 $392,844 $0.000 $63.250 $84.210 53.258 $116.508 48.930 $165.438 147.400 70,178 $217.578 $383.017 Actual 147.400 % of Sales 29 days 50 days 3X -turnover 23.3% 65.8% 45.4% 64.20% 66.83% Same as last year 2014 # Plus F25 438.7% 4.5445969 4.2910842 4.3242001 71.86% 77.60% 71.40% 66.56% 2014 # plus this year Dep Expense 66.50%Step by Step Solution
There are 3 Steps involved in it
Step: 1

Get Instant Access to Expert-Tailored Solutions
See step-by-step solutions with expert insights and AI powered tools for academic success
Step: 2

Step: 3
Ace Your Homework with AI
Get the answers you need in no time with our AI-driven, step-by-step assistance
Get Started
Innovation And Finance
Authors: Andreas Pyka, Hans-Peter Burghof
1st Edition
0415696852, 978-0415696852