Question
Their 1.5 inch, 90-degree copper elbow (see below) is a very popular item in the plumbing line that comes packaged in 10 elbows per box.
Their 1.5 inch, 90-degree copper elbow (see below) is a very popular item in the plumbing line that comes packaged in 10 elbows per box. The box costs about $65 to Western, and Western sells it at $100 per box, gaining a $35 profit margin.
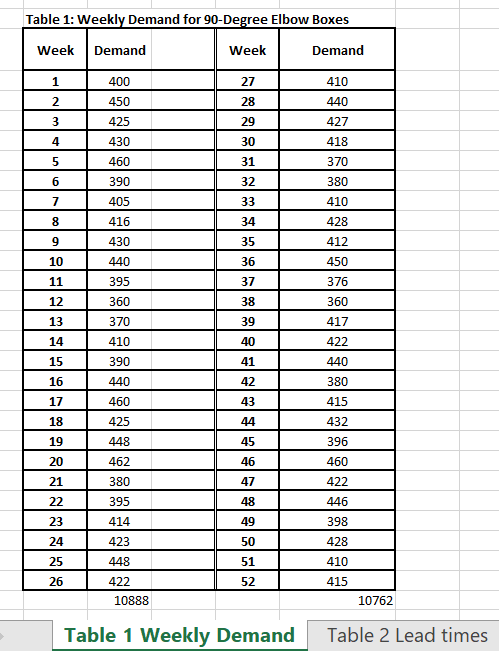
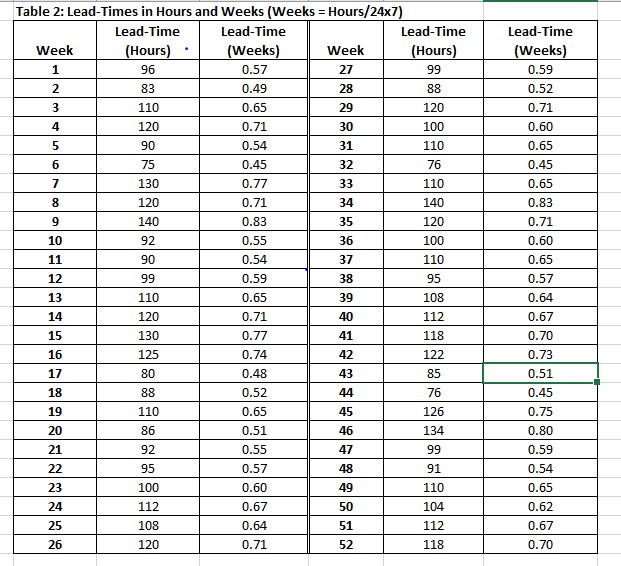
Western operates 52 weeks in a year. The weekly demand pattern and order lead-time for copper elbows are recorded over the last 52 weeks and are given in Table 1 and Table 2 respectively (see below). Although the leadtime is recorded in hours from the order placement time to the order receipt time, for safety stock computations it is converted into weeks. Each complete order arrives in the same shipment, and splitting the order amount is not an option for the distributor. Although owing to variation in weekly demand, the safety stock carried over from one cycle to the next may vary, though not substantially, but it can be safely assumed that the average safety stock will still be constant throughout the year
The holding cost is applied on each box worth $65 that is held in inventory. This includes the interest payments on inventory of this product, stacking and handling of boxes and the cost of storage space. The holding cost as a percentage of the value of inventory stays more or less the same in each year. According to a recent past estimate, the company carried $1.5 million worth of copper elbows and the holding cost in accounting records was listed as $225,000. The holding costs are not only incurred on the regular depleting inventory under economic order modeling but also on the constant safety stock that is required to manage the variations in weekly consumption and the variation in lead times. The management carries safety stock that allows it to maintain a 98% stock availability at all times. Therefore, the management decided to respond to those 2% out-of-stock chances through an out-of-pocket policy. Similar copper elbows from a different vendor are available from local Home Depot in loose quantities at $8.50 a piece. Western packages these replacement copper elbows for its customers costing them $90 a box that includes the purchase cost and the packaging time. This replacement product is acceptable to customers during desperate times provided there is a price discount from Western. Western decided to sell this replacement box to its valued customers at $50 a box which costed them $90. The $40 loss per box is treated as a stock-out cost for Western to avoid losing their valued customers. Western management estimates that each order costs about $2500 in terms of placing the order, clerical time, receiving, off-loading, counting and verifying the quantity against the order.
CASE DISCUSSION QUESTIONS
1. Change the value of the order cycle length (i.e., order length T = 2, 3, 4, 5, 6, 7, 8, 9, and 10 weeks). For each length, calculate the order size, number of orders, the afore-mentioned four costs, and the total cost.
2. Make a plot of the four costs and the total costs against the order cycle length.
3. Using the analysis from Question 1 and Question 2 above, recommend a good order cycle length to the Western management team. Justify your recommendation, and discuss any interesting cost behaviour that you noticed.
4. Western is a highly-leveraged company and mostly funds the inventory and operations through business loans. Therefore, a major part of the holding cost percentage is the interest payments made. If interest rates go up in future, it can potentially raise the holding costs as a percentage of the product value, therefore motivating the company to reduce its order cycle length. What is the impact of a 20% (i.e., current holding cost percent *1.20), a 30% increase in holding cost percentage, or a 70% increase in holding cost percentage? Does a new order cycle length become optimal?


Step by Step Solution
There are 3 Steps involved in it
Step: 1

Get Instant Access to Expert-Tailored Solutions
See step-by-step solutions with expert insights and AI powered tools for academic success
Step: 2

Step: 3

Ace Your Homework with AI
Get the answers you need in no time with our AI-driven, step-by-step assistance
Get Started


