

Question
There are different methods of checking data normality like PP-plot, histogram, normality tests and skewness and kurtosis. Following is the SPSS result of checking data
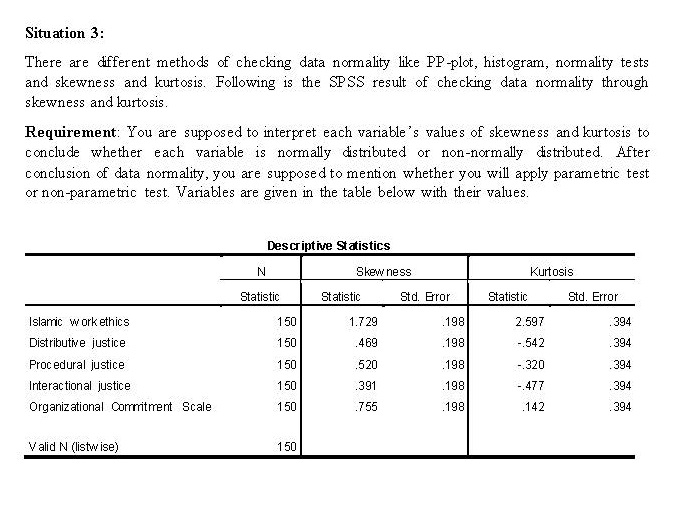
There are different methods of checking data normality like PP-plot, histogram, normality tests and skewness and kurtosis. Following is the SPSS result of checking data normality through skewness and kurtosis.
Requirement: You are supposed to interpret each variable's values of skewness and kurtosis to conclude whether each variable is normally distributed or non-normally distributed. After conclusion of data normality, you are supposed to mention whether you will apply parametric test or non-parametric test. Variables are given in the table below with their values.
Table in Attachment
D
Step by Step Solution
There are 3 Steps involved in it
Step: 1

Get Instant Access to Expert-Tailored Solutions
See step-by-step solutions with expert insights and AI powered tools for academic success
Step: 2

Step: 3
Ace Your Homework with AI
Get the answers you need in no time with our AI-driven, step-by-step assistance
Get Started
Quantitative Analysis For Management
Authors: Barry Render, Ralph M. Stair, Michael E. Hanna
11th Edition
9780132997621, 132149117, 132997622, 978-0132149112