there has to be descriptive headings for the distrubtion table and the student expenditure written as an interval. The graph must have a descriptive title, the axis appropriately labeled, the bars of the histogram must be fifferent colors and have no gaps between them.
if any specific functions are used to complete this assignment in excel please state the functions used
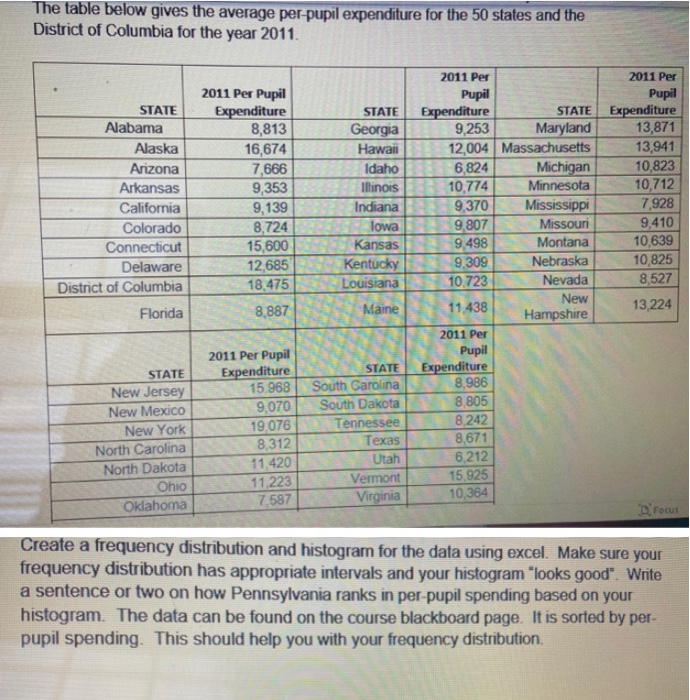
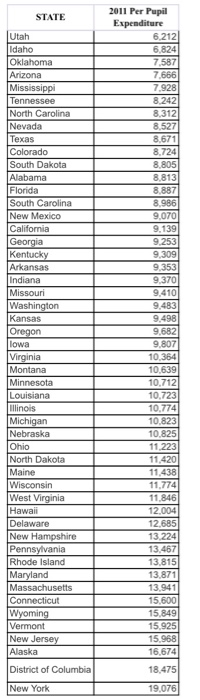
The table below gives the average per-pupil expenditure for the 50 states and the District of Columbia for the year 2011 STATE Alabama Alaska Arizona Arkansas California Colorado Connecticut Delaware District of Columbia 2011 Per Pupil Expenditure 8,813 16,674 7,666 9,353 9,139 8,724 15,600 12,685 18,475 STATE Georgia Hawaii Idaho Illinois Indiana lowa Kansas Kentucky Louisiana 2011 Per Pupil Expenditure STATE 9,253 Maryland 12,004 Massachusetts 6,824 Michigan 10,774 Minnesota 9,370 Mississippi 9,807 Missouri 9,498 Montana 9.309 Nebraska 10.723 Nevada New 11.438 Hampshire 2011 Per Pupil Expenditure 8,986 8.805 8,242 8,671 6,212 15.925 10,364 2011 Per Pupil Expenditure 13,871 13,941 10,823 10,712 7,928 9,410 10,639 10,825 8,527 13,224 Florida 8.887 Maine STATE New Jersey New Mexico New York North Carolina North Dakota Ohio Oklahoma 2011 Per Pupil Expenditure 15 968 9,070 19,076 8,312 11,420 11.223 7,587 STATE South Carolina South Dakota Tennessee Texas Utah Vermont Virginia D Focus Create a frequency distribution and histogram for the data using excel. Make sure your frequency distribution has appropriate intervals and your histogram "looks good". Write a sentence or two on how Pennsylvania ranks in per-pupil spending based on your histogram. The data can be found on the course blackboard page. It is sorted by per- pupil spending. This should help you with your frequency distribution. STATE Utah Idaho Oklahoma Arizona Mississippi Tennessee North Carolina Nevada Texas Colorado South Dakota Alabama Florida South Carolina New Mexico California Georgia Kentucky Arkansas Indiana Missouri Washington Kansas Oregon lowa Virginia Montana Minnesota Louisiana Illinois Michigan Nebraska Ohio North Dakota Maine Wisconsin West Virginia Hawaii Delaware New Hampshire Pennsylvania Rhode Island Maryland Massachusetts Connecticut Wyoming Vermont New Jersey Alaska District of Columbia 2011 Per Pupil Expenditure 6.212 6,824 7,587 7,666 7,928 8.242 8.312 8.527 8.671 8,724 8,805 8.813 8.887 8,986 9.070 9.139 9.253 9,309 9,353 9,370 9.410 9.483 9,498 9,682 9.807 10,364 10.639 10.712 10.723 10.774 10.823 10.825 11.223 11,420 11,438 11.774 11.846 12.004 12.685 13.224 13.467 13.815 13.871 13.941 15,600 15,849 15.925 15.968 16,674 18.475 New York 19,076 The table below gives the average per-pupil expenditure for the 50 states and the District of Columbia for the year 2011 STATE Alabama Alaska Arizona Arkansas California Colorado Connecticut Delaware District of Columbia 2011 Per Pupil Expenditure 8,813 16,674 7,666 9,353 9,139 8,724 15,600 12,685 18,475 STATE Georgia Hawaii Idaho Illinois Indiana lowa Kansas Kentucky Louisiana 2011 Per Pupil Expenditure STATE 9,253 Maryland 12,004 Massachusetts 6,824 Michigan 10,774 Minnesota 9,370 Mississippi 9,807 Missouri 9,498 Montana 9.309 Nebraska 10.723 Nevada New 11.438 Hampshire 2011 Per Pupil Expenditure 8,986 8.805 8,242 8,671 6,212 15.925 10,364 2011 Per Pupil Expenditure 13,871 13,941 10,823 10,712 7,928 9,410 10,639 10,825 8,527 13,224 Florida 8.887 Maine STATE New Jersey New Mexico New York North Carolina North Dakota Ohio Oklahoma 2011 Per Pupil Expenditure 15 968 9,070 19,076 8,312 11,420 11.223 7,587 STATE South Carolina South Dakota Tennessee Texas Utah Vermont Virginia D Focus Create a frequency distribution and histogram for the data using excel. Make sure your frequency distribution has appropriate intervals and your histogram "looks good". Write a sentence or two on how Pennsylvania ranks in per-pupil spending based on your histogram. The data can be found on the course blackboard page. It is sorted by per- pupil spending. This should help you with your frequency distribution. STATE Utah Idaho Oklahoma Arizona Mississippi Tennessee North Carolina Nevada Texas Colorado South Dakota Alabama Florida South Carolina New Mexico California Georgia Kentucky Arkansas Indiana Missouri Washington Kansas Oregon lowa Virginia Montana Minnesota Louisiana Illinois Michigan Nebraska Ohio North Dakota Maine Wisconsin West Virginia Hawaii Delaware New Hampshire Pennsylvania Rhode Island Maryland Massachusetts Connecticut Wyoming Vermont New Jersey Alaska District of Columbia 2011 Per Pupil Expenditure 6.212 6,824 7,587 7,666 7,928 8.242 8.312 8.527 8.671 8,724 8,805 8.813 8.887 8,986 9.070 9.139 9.253 9,309 9,353 9,370 9.410 9.483 9,498 9,682 9.807 10,364 10.639 10.712 10.723 10.774 10.823 10.825 11.223 11,420 11,438 11.774 11.846 12.004 12.685 13.224 13.467 13.815 13.871 13.941 15,600 15,849 15.925 15.968 16,674 18.475 New York 19,076