

Question
There is a table below that shows the number of absences and the score on the final exam for a sample of the students. a.
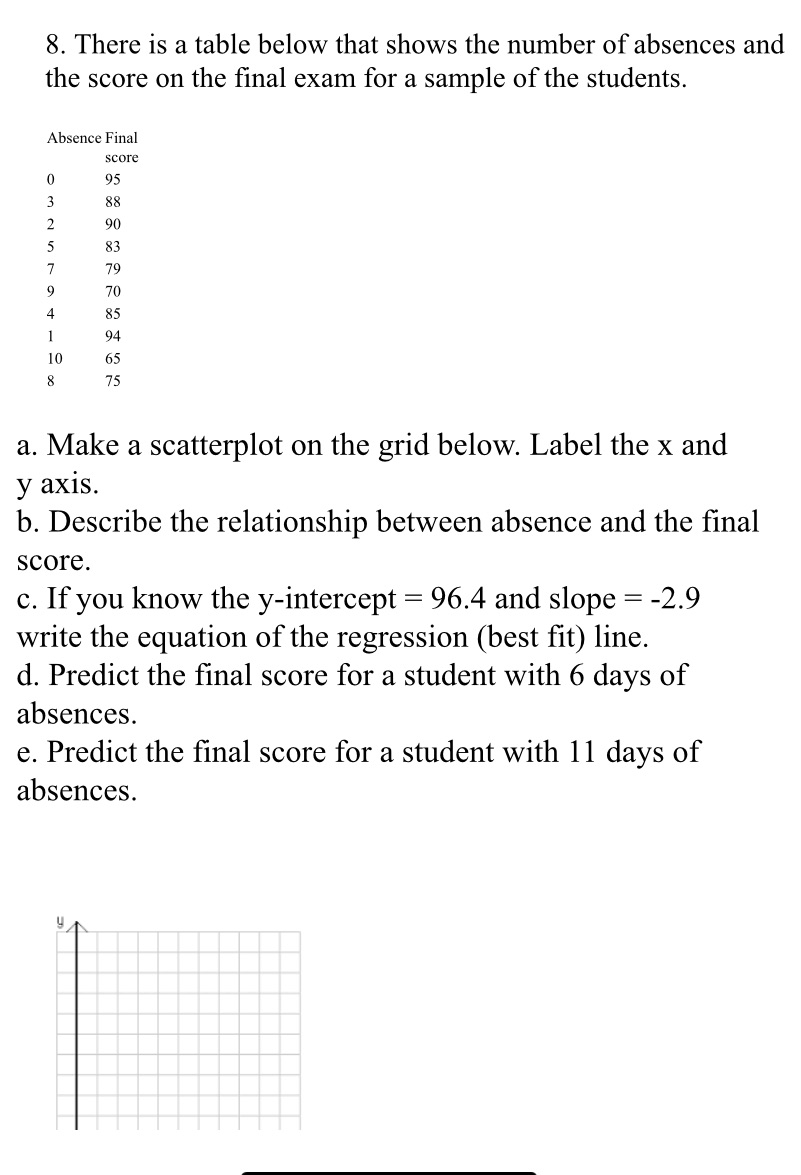
There is a table below that shows the number of absences and the score on the final exam for a sample of the students. a. Make a scatterplot on the grid below. Label the x andy axis.b. Describe the relationship between absence and the final score.c. If you know the y-intercept = 96.4 and slope = -2.9write the equation of the regression (best fit) line.d. Predict the final score for a student with 6 days of absences.e. Predict the final score for a student with 11 days of absences. AbsenceFinal score0953882905837799704851941065875 a. Make a scatterplot on the grid below. Label the x andy axis.b. Describe the relationship between absence and the final score.c. If you know the y-intercept = 96.4 and slope = -2.9write the equation of the regression (best fit) line.d. Predict the final score for a student with 6 days of absences.e. Predict the final score for a student with 11 days of absences.
Step by Step Solution
There are 3 Steps involved in it
Step: 1

Get Instant Access to Expert-Tailored Solutions
See step-by-step solutions with expert insights and AI powered tools for academic success
Step: 2

Step: 3
Ace Your Homework with AI
Get the answers you need in no time with our AI-driven, step-by-step assistance
Get Started