

Answered step by step
Verified Expert Solution
Question
1 Approved Answer
There is no more information to add ya douchebag, stop flagging the question Blooper's analysts have come up with the following revised estimates for its
There is no more information to add ya douchebag, stop flagging the question
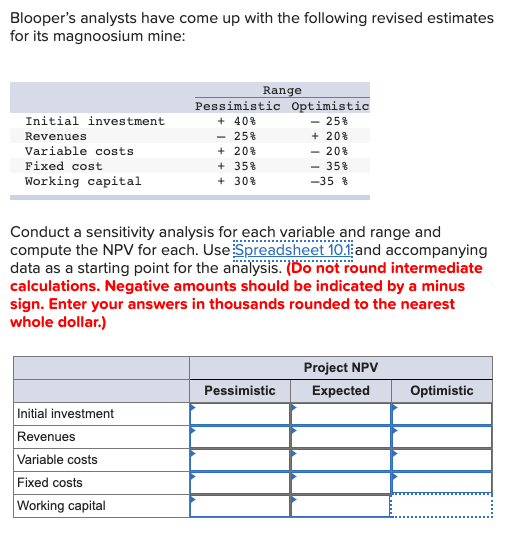
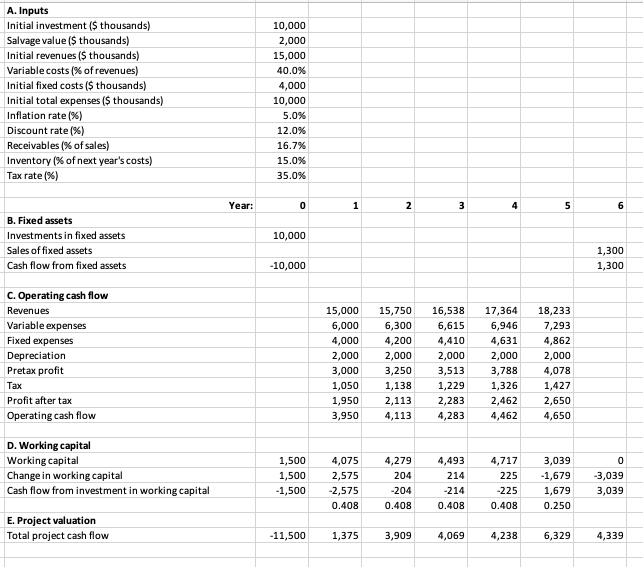
Blooper's analysts have come up with the following revised estimates for its magnoosium mine: Range Pessimistic Optimistic Initial investment 40% 25% Revenues 25% 20% Variable costs 20% 20% Fixed cost + 35% 35% Working capital 30% -35& Conduct a sensitivity analysis for each variable and range and compute the NPV for each. Use Spreadsheet 10.1ad accompanying data as a starting point for the aalysis. (Bo not round intermediate calculations. Negative amounts should be indicated by a minus sign. Enter your answers in thousands rounded to the nearest whole dollar.) Project NPV Pessimistic Expected Optimistic Initial investment Revenues Variable costs Fixed costs Working capital A. Inputs Initial investment ($ thousands) Salvage value ($ thousands) Initial revenues ($ thousands) Variable costs (% of revenues ) 10,000 2,000 15,000 40.0% Initial fixed costs ($ thousands) Initial total expenses ($ thousands) Inflation rate ( % ) Discount rate (% ) Receivables (% of sales) 4,000 10,000 5.0% 12.0% 16.7% Inventory (% of next year's costs) Tax rate (%) 15.0% 35.0 % Year 4 6 0 1 2 B. Fixed assets Investments in fixed assets 10,000 1,300 1,300 Sales of fixed assets Cash flow from fixed assets -10,000 C. Operating cash flow 15,000 16,538 6,615 18,233 Revenues 15,750 17,364 Variable expenses 6,300 4,200 6,000 6,946 7,293 Fixed expenses 4,000 4,410 4,631 4,862 Depreciation 2,000 2,000 2,000 2,000 2,000 Pretax profit 3,000 3,250 3,513 3,788 4,078 1,138 1,427 ax 1,050 1,229 1,326 1,950 3,950 Profit after tax 2,462 2,113 2,283 2,650 Operating cash flow 4,113 4,283 4,462 4,650 D. Working capital Working capital Change in working capital Cash flow from investment in working capital 3,039 1,679 1,679 4,279 4,493 1,500 4,075 4,717 0 1,500 2,575 204 214 225 -3,039 3,039 1,500 2,575 204 214 -225 0.408 0.408 0.408 0.408 0.250 E. Project valuation Total project cash flow 3,909 11,500 1,375 4,069 4,238 6,329 4,339 Blooper's analysts have come up with the following revised estimates for its magnoosium mine: Range Pessimistic Optimistic Initial investment 40% 25% Revenues 25% 20% Variable costs 20% 20% Fixed cost + 35% 35% Working capital 30% -35& Conduct a sensitivity analysis for each variable and range and compute the NPV for each. Use Spreadsheet 10.1ad accompanying data as a starting point for the aalysis. (Bo not round intermediate calculations. Negative amounts should be indicated by a minus sign. Enter your answers in thousands rounded to the nearest whole dollar.) Project NPV Pessimistic Expected Optimistic Initial investment Revenues Variable costs Fixed costs Working capital A. Inputs Initial investment ($ thousands) Salvage value ($ thousands) Initial revenues ($ thousands) Variable costs (% of revenues ) 10,000 2,000 15,000 40.0% Initial fixed costs ($ thousands) Initial total expenses ($ thousands) Inflation rate ( % ) Discount rate (% ) Receivables (% of sales) 4,000 10,000 5.0% 12.0% 16.7% Inventory (% of next year's costs) Tax rate (%) 15.0% 35.0 % Year 4 6 0 1 2 B. Fixed assets Investments in fixed assets 10,000 1,300 1,300 Sales of fixed assets Cash flow from fixed assets -10,000 C. Operating cash flow 15,000 16,538 6,615 18,233 Revenues 15,750 17,364 Variable expenses 6,300 4,200 6,000 6,946 7,293 Fixed expenses 4,000 4,410 4,631 4,862 Depreciation 2,000 2,000 2,000 2,000 2,000 Pretax profit 3,000 3,250 3,513 3,788 4,078 1,138 1,427 ax 1,050 1,229 1,326 1,950 3,950 Profit after tax 2,462 2,113 2,283 2,650 Operating cash flow 4,113 4,283 4,462 4,650 D. Working capital Working capital Change in working capital Cash flow from investment in working capital 3,039 1,679 1,679 4,279 4,493 1,500 4,075 4,717 0 1,500 2,575 204 214 225 -3,039 3,039 1,500 2,575 204 214 -225 0.408 0.408 0.408 0.408 0.250 E. Project valuation Total project cash flow 3,909 11,500 1,375 4,069 4,238 6,329 4,339Step by Step Solution
There are 3 Steps involved in it
Step: 1

Get Instant Access to Expert-Tailored Solutions
See step-by-step solutions with expert insights and AI powered tools for academic success
Step: 2

Step: 3
Ace Your Homework with AI
Get the answers you need in no time with our AI-driven, step-by-step assistance
Get Started
Credit Spreads Beginners Guide To Low Risk Secure Easy To Manage Consistent Profits For Long Term Wealth Creation
Authors: Casey Boon
1st Edition
1974677419, 978-1974677412