 These are the data, there is more, but only up to 20 days is required to be tested with the filters.
| Date | Open | High | Low | Close | Volume | Adj Close |
| 1-Jul-15 | 1.56 | 1.565 | 1.512 | 1.52 | 3,465,500 | 1.186 |
| 2-Jul-15 | 1.53 | 1.545 | 1.52 | 1.535 | 3,747,800 | 1.1977 |
| 3-Jul-15 | 1.51 | 1.52 | 1.46 | 1.505 | 4,342,600 | 1.1743 |
| 6-Jul-15 | 1.49 | 1.495 | 1.46 | 1.475 | 1,364,900 | 1.1509 |
| 7-Jul-15 | 1.48 | 1.5 | 1.465 | 1.485 | 2,227,900 | 1.1587 |
| 8-Jul-15 | 1.465 | 1.485 | 1.43 | 1.445 | 2,660,500 | 1.1275 |
| 9-Jul-15 | 1.44 | 1.45 | 1.425 | 1.435 | 3,935,900 | 1.1197 |
| 10-Jul-15 | 1.45 | 1.46 | 1.38 | 1.395 | 3,977,400 | 1.0885 |
| 13-Jul-15 | 1.385 | 1.41 | 1.38 | 1.4 | 2,209,600 | 1.0924 |
| 14-Jul-15 | 1.425 | 1.44 | 1.415 | 1.425 | 1,979,100 | 1.1119 |
| 15-Jul-15 | 1.43 | 1.435 | 1.42 | 1.425 | 4,129,200 | 1.1119 |
| 16-Jul-15 | 1.44 | 1.44 | 1.395 | 1.4 | 3,523,400 | 1.0924 |
| 17-Jul-15 | 1.425 | 1.505 | 1.42 | 1.495 | 4,036,900 | 1.1665 |
| 20-Jul-15 | 1.5 | 1.535 | 1.48 | 1.495 | 2,466,700 | 1.1665 |
| 21-Jul-15 | 1.495 | 1.515 | 1.445 | 1.485 | 1,734,700 | 1.1587 |
| 22-Jul-15 | 1.49 | 1.51 | 1.48 | 1.5 | 1,836,200 | 1.1704 |
| 23-Jul-15 | 1.5 | 1.51 | 1.495 | 1.5 | 2,844,800 | 1.1704 |
| 24-Jul-15 | 1.495 | 1.52 | 1.495 | 1.505 | 1,278,900 | 1.1743 |
| 27-Jul-15 | 1.505 | 1.54 | 1.502 | 1.52 | 3,264,100 | 1.186 |
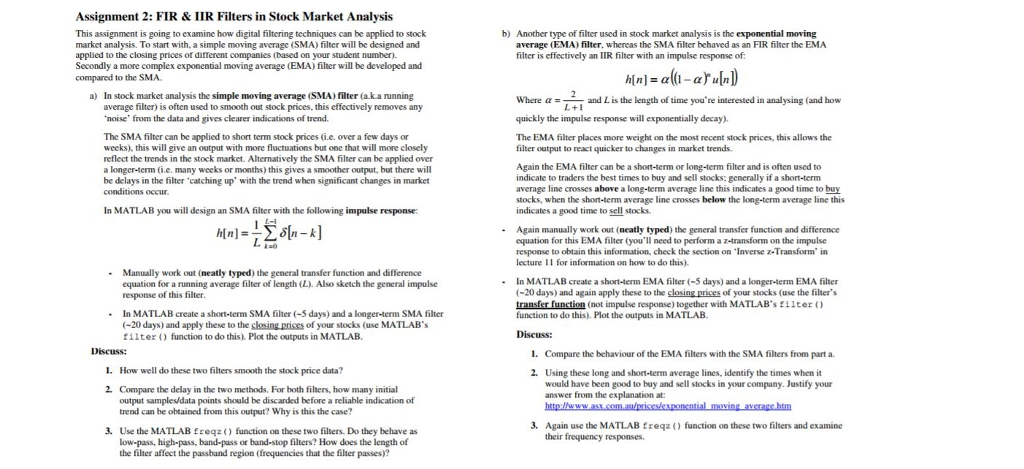
Assignment 2: FIR & IIR Filters in Stock Market Analysis This assignment is going to examine how digital filtering techniques can be applied to stock market analysis. To start with, a simple moving average (SMA) filter will be designed and applied to the closing prices of different companies (based on your student number Secondly a more complex exponential moving average (EMA) filter will be developed and compared to the SMA. a) In stock market analysis the simple moving average (SMA)filter (a.ka running average filter) is often used to smooth out stock prices. this effectively removes any noise from the data and gives clearer indications of trend. The SMA filter can be applied to short tenm stock prices (i.e. over a few days or weeks), this will give an output with more fluctuations but one that will more closely reflect the trends the stock market. Alternatively the SMA filter can be applied over a longer-term (i.c. many weeks or months) this gives a smoother output, but there will be delays in the filter catching up' with the trend when significant changes in market conditions occur, In MATLAB you will design an SMA filter with the following impulse response: L-I Manually work out (neatly typed) the general transfer function and difference equation for a running average filter of length (L). Also sketch the general impulse response of this filter. In MATLAB create a short-term SMA filter (-5 days) and a longer-term SMA filter 20 days) and apply these to the gksing prices of your stocks (use MATLAB filter function to do this) Plot the outputs in MATLAB. How well do these two filters smooth the stock price data 2. Compare the delay in the two methods. For both filters, how many initial output samplesdata points should be discarded before a reliable indication of trend can be obtained from this output? Why is this the case? Use the MATLAB freqz function on these two filters. Do they behave as low-pass, high-pass, band-pass or band-stop filters? How does the length of the filter affect the passband region (frequencies that the filter passes)? b) Another type of filter used in stock market analysis is the exponential moving average (EMA) filter, whereas the SMA filter behaved as an FIR filter the EMA filter is effectively an IIR filter with an impulse response hln Where a and Lis the length of time you're interested in analysing (and how L+ quickly the impulse response will exponentially decay. The EMA filter places more weight on the most recent stock prices, this allows the filter output to react quicker to changes in market trends. Again the EMA filter can be a short-term or long-term filter and is often used to indicate to traders the best times to buy and sell stocks: generally if a short-term average line crosses above a long-term average line this indicates a good time to buy stocks, when the short-term average line crosses below the long-term average line this indicates a good time to sell stocks. Again manually work out neatly typed) the general transfer function and difference equation for this EMA filter (you'll need to perform a z-transform on the impulse response to obtain this information, check the section on Inverse z-Transform' in lecture for information on how to do this). In MATLAB create a short-term EMA filter (-5 days) and a longer-term EMA filter 20 days) and again apply these to the glosing prices of your stocks (use the filter's tie not impulse response) together with MATLAB's filter function to do this). Plot the outputs in MATLAB Discuss: i. Compare the behaviour of the EMA filters with the SMA filters from part a. 2. Using these long and short-term average lines. identify the times when it would have been good to buy and sell stocks in your company. Justify your answer from the explanation at: 3. Again use the MATLAB fr function on these two filters and examine their frequency responses. Assignment 2: FIR & IIR Filters in Stock Market Analysis This assignment is going to examine how digital filtering techniques can be applied to stock market analysis. To start with, a simple moving average (SMA) filter will be designed and applied to the closing prices of different companies (based on your student number Secondly a more complex exponential moving average (EMA) filter will be developed and compared to the SMA. a) In stock market analysis the simple moving average (SMA)filter (a.ka running average filter) is often used to smooth out stock prices. this effectively removes any noise from the data and gives clearer indications of trend. The SMA filter can be applied to short tenm stock prices (i.e. over a few days or weeks), this will give an output with more fluctuations but one that will more closely reflect the trends the stock market. Alternatively the SMA filter can be applied over a longer-term (i.c. many weeks or months) this gives a smoother output, but there will be delays in the filter catching up' with the trend when significant changes in market conditions occur, In MATLAB you will design an SMA filter with the following impulse response: L-I Manually work out (neatly typed) the general transfer function and difference equation for a running average filter of length (L). Also sketch the general impulse response of this filter. In MATLAB create a short-term SMA filter (-5 days) and a longer-term SMA filter 20 days) and apply these to the gksing prices of your stocks (use MATLAB filter function to do this) Plot the outputs in MATLAB. How well do these two filters smooth the stock price data 2. Compare the delay in the two methods. For both filters, how many initial output samplesdata points should be discarded before a reliable indication of trend can be obtained from this output? Why is this the case? Use the MATLAB freqz function on these two filters. Do they behave as low-pass, high-pass, band-pass or band-stop filters? How does the length of the filter affect the passband region (frequencies that the filter passes)? b) Another type of filter used in stock market analysis is the exponential moving average (EMA) filter, whereas the SMA filter behaved as an FIR filter the EMA filter is effectively an IIR filter with an impulse response hln Where a and Lis the length of time you're interested in analysing (and how L+ quickly the impulse response will exponentially decay. The EMA filter places more weight on the most recent stock prices, this allows the filter output to react quicker to changes in market trends. Again the EMA filter can be a short-term or long-term filter and is often used to indicate to traders the best times to buy and sell stocks: generally if a short-term average line crosses above a long-term average line this indicates a good time to buy stocks, when the short-term average line crosses below the long-term average line this indicates a good time to sell stocks. Again manually work out neatly typed) the general transfer function and difference equation for this EMA filter (you'll need to perform a z-transform on the impulse response to obtain this information, check the section on Inverse z-Transform' in lecture for information on how to do this). In MATLAB create a short-term EMA filter (-5 days) and a longer-term EMA filter 20 days) and again apply these to the glosing prices of your stocks (use the filter's tie not impulse response) together with MATLAB's filter function to do this). Plot the outputs in MATLAB Discuss: i. Compare the behaviour of the EMA filters with the SMA filters from part a. 2. Using these long and short-term average lines. identify the times when it would have been good to buy and sell stocks in your company. Justify your answer from the explanation at: 3. Again use the MATLAB fr function on these two filters and examine their frequency responses