

Question
These Are the Normal Data series Provided for Food retailing: These are the forecasted DATA and Highlighted one are the further Forecasted tIll ( Jan
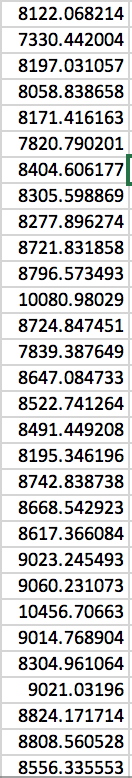
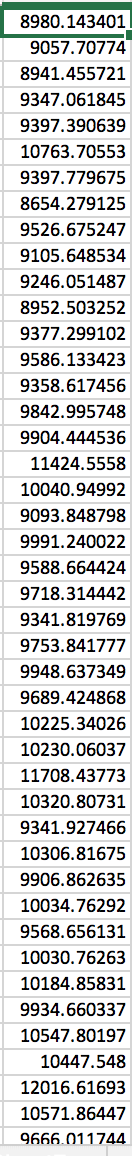
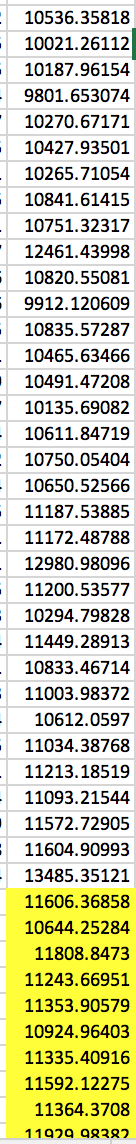
These Are the Normal Data series Provided for Food retailing:
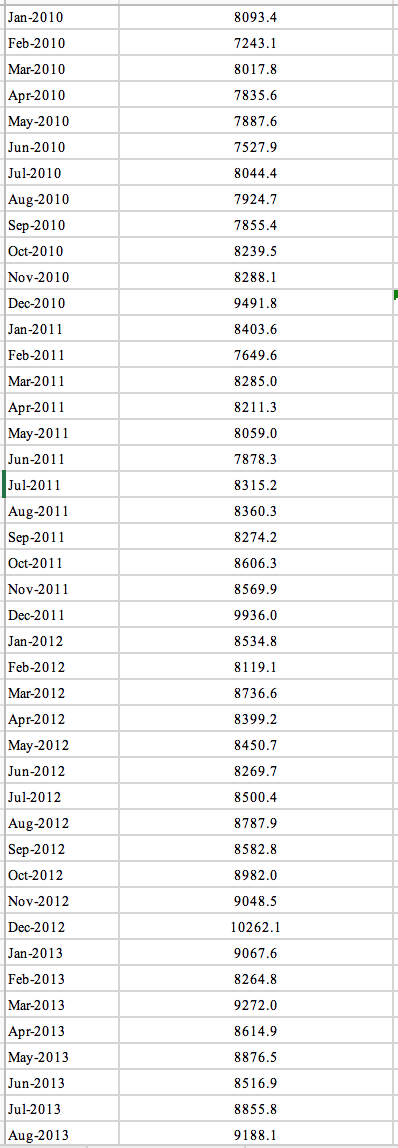
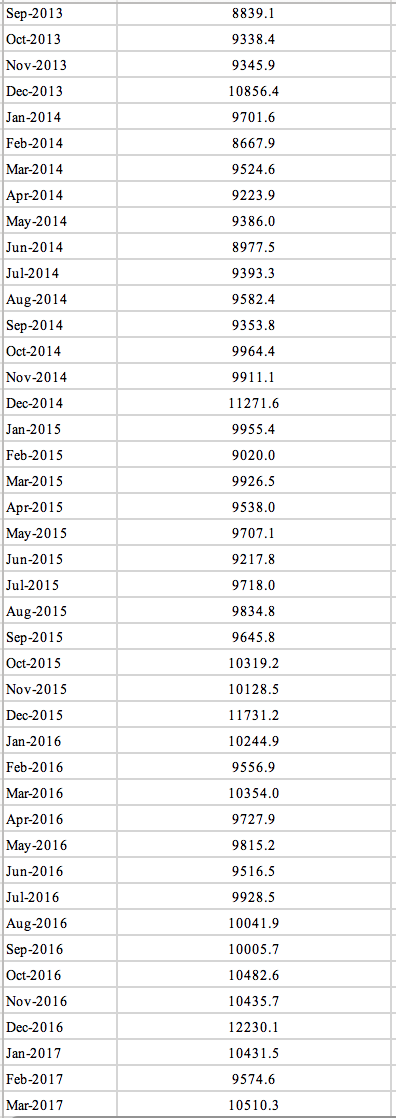
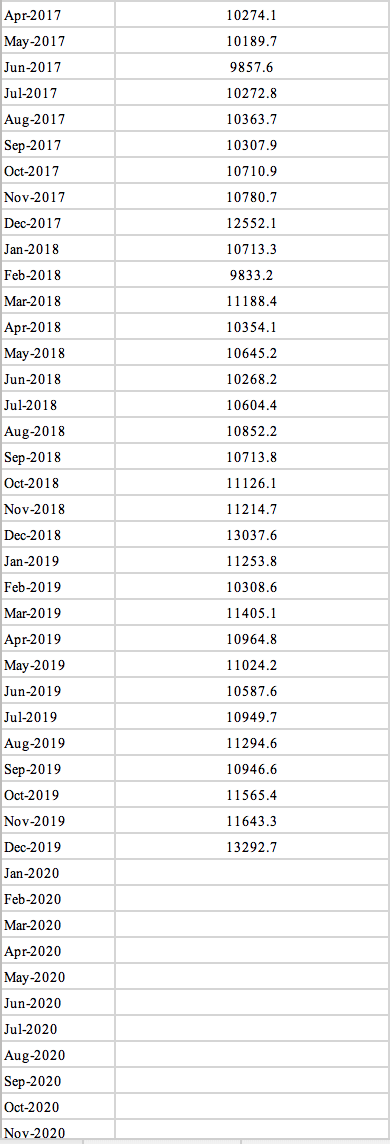
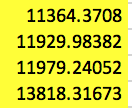
These are the forecasted DATA and Highlighted one are the further Forecasted tIll (Jan 2020 to Dec 2020) And forecasted Data starts from Jan 2011
Question to be answered in context to Business forecasting:
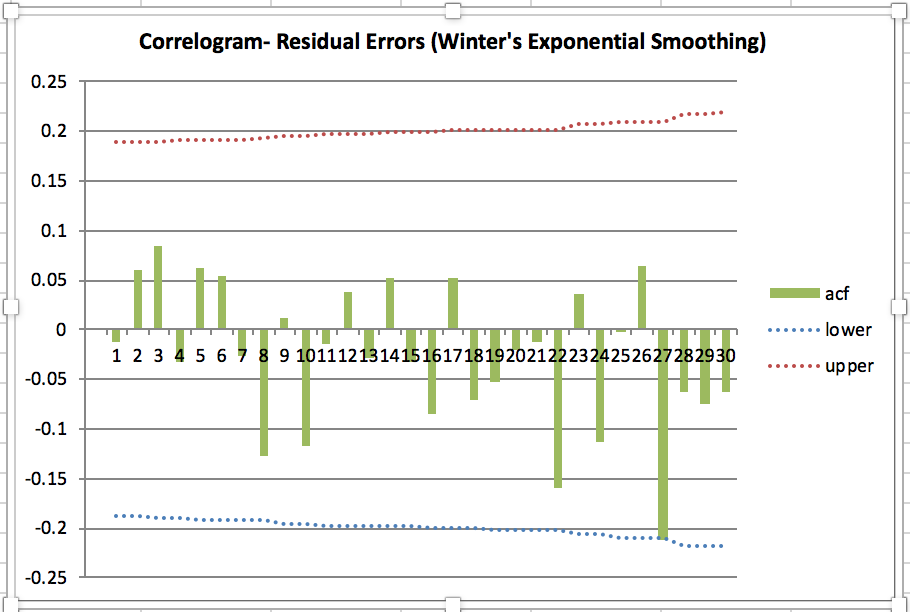
The X axis indicate lags and Y axis indicates Error
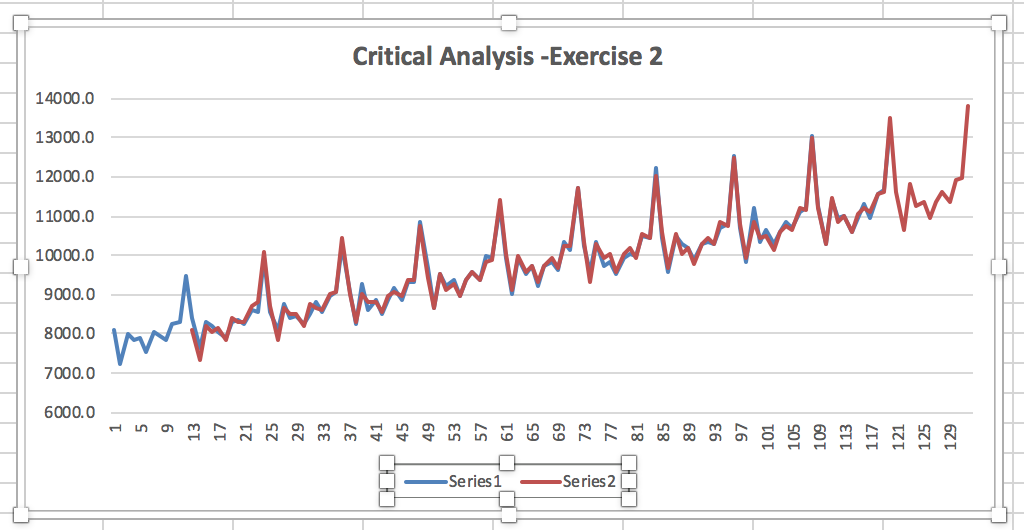
Q1) Critically analyse and comment on your smoothing.
Q2) Perform the appropriate check/s and test/s that help critically analyse whether your model has
captured all the systematic components and/or whether the errors are random. Explain your answer.
Jan-2010 8093.4 Feb-2010 7243.1 Mar-2010 8017.8 7835.6 Apr-2010 May-2010 Jun-2010 7887.6 7527.9 Jul-2010 8044.4 7924.7 7855.4 Aug-2010 Sep-2010 Oct-2010 Nov-2010 8239.5 8288.1 Dec-2010 9491.8 Jan-2011 8403.6 Feb-2011 7649.6 8285.0 8211.3 8059.0 7878.3 Mar-2011 Apr-2011 May-2011 Jun-2011 Jul-2011 Aug-2011 Sep-2011 Oct-2011 Nov-2011 8315.2 8360.3 8274.2 8606.3 8569.9 Dec-2011 9936.0 Jan-2012 8534.8 Feb-2012 8119.1 8736.6 8399.2 8450.7 8269.7 8500.4 Mar-2012 Apr-2012 May-2012 Jun-2012 Jul-2012 Aug-2012 Sep-2012 Oct-2012 Nov-2012 Dec-2012 Jan-2013 8787.9 8582.8 8982.0 9048.5 10262.1 9067.6 8264.8 Feb-2013 Mar-2013 9272.0 8614.9 8876.5 Apr-2013 May-2013 Jun-2013 Jul-2013 Aug-2013 8516.9 8855.8 9188.1 8839.1 Sep-2013 Oct-2013 Nov-2013 9338.4 9345.9 Dec-2013 10856.4 Jan-2014 9701.6 Feb-2014 8667.9 Mar-2014 9524.6 9223.9 Apr-2014 May-2014 9386.0 Jun-2014 8977.5 9393.3 9582.4 Jul-2014 Aug-2014 Sep-2014 Oct-2014 Nov-2014 9353.8 9964.4 9911.1 Dec-2014 11271.6 Jan-2015 9955.4 Feb-2015 9020.0 Mar-2015 9926.5 9538.0 Apr-2015 May-2015 Jun-2015 9707.1 9217.8 Jul-2015 9718.0 9834.8 9645.8 Aug-2015 Sep-2015 Oct-2015 Nov-2015 10319.2 10128.5 11731.2 Dec-2015 Jan-2016 10244.9 Feb-2016 9556.9 Mar-2016 10354.0 9727.9 Apr-2016 May-2016 9815.2 Jun-2016 9516.5 9928.5 10041.9 Jul-2016 Aug-2016 Sep-2016 Oct-2016 Nov-2016 10005.7 10482.6 10435.7 Dec-2016 12230.1 Jan-2017 10431.5 Feb-2017 9574.6 Mar-2017 10510.3 10274.1 10189.7 9857.6 10272.8 Apr-2017 May-2017 Jun-2017 Jul-2017 Aug-2017 Sep-2017 Oct-2017 Nov-2017 10363.7 10307.9 10710.9 10780.7 Dec-2017 12552.1 Jan-2018 10713.3 Feb-2018 9833.2 Mar-2018 11188.4 Apr-2018 May-2018 10354.1 10645.2 Jun-2018 10268.2 Jul-2018 10604.4 10852.2 10713.8 Aug-2018 Sep-2018 Oct-2018 Nov-2018 11126.1 11214.7 Dec-2018 13037.6 11253.8 Jan-2019 Feb-2019 10308.6 Mar-2019 11405.1 10964.8 Apr-2019 May-2019 11024.2 10587.6 10949.7 11294.6 Jun-2019 Jul-2019 Aug-2019 Sep-2019 Oct-2019 Nov-2019 10946.6 11565.4 11643.3 Dec-2019 13292.7 Jan-2020 Feb-2020 Mar-2020 Apr-2020 May-2020 Jun-2020 Jul-2020 Aug-2020 Sep-2020 Oct-2020 Nov-2020 8122.068214 7330.442004 8197.031057 8058.838658 8171.416163 7820.790201 8404.606177 8305.598869 8277.896274 8721.831858 8796.573493 10080.98029 8724.847451 7839.387649 8647.084733 8522.741264 8491.449208 8195.346196 8742.838738 8668.542923 8617.366084 9023.245493 9060.231073 10456.70663 9014.768904 8304.961064 9021.03196 8824.171714 8808.560528 8556.335553 8980.143401 9057.70774 8941.455721 9347.061845 9397.390639 10763.70553 9397.779675 8654.279125 9526.675247 9105.648534 9246.051487 8952.503252 9377.299102 9586.133423 9358.617456 9842.995748 9904.444536 11424.5558 10040.94992 9093.848798 9991.240022 9588.664424 9718.314442 9341.819769 9753.841777 9948.637349 9689.424868 10225.34026 10230.06037 11708.43773 10320.80731 9341.927466 10306.81675 9906.862635 10034.76292 9568.656131 10030.76263 10184.85831 9934.660337 10547.80197 10447.548 12016.61693 10571.86447 9666.011744 10536.35818 10021.26112 10187.96154 9801.653074 10270.67171 10427.93501 10265.71054 10841.61415 10751.32317 12461.43998 10820.55081 9912.120609 10835.57287 10465.63466 10491.47208 10135.69082 10611.84719 10750.05404 10650.52566 11187.53885 11172.48788 12980.98096 11200.53577 10294.79828 11449.28913 10833.46714 11003.98372 10612.0597 11034.38768 11213.18519 11093.21544 11572.72905 11604.90993 13485.35121 11606.36858 10644.25284 11808.8473 11243.66951 11353.90579 10924.96403 11335.40916 11592.12275 11364.3708 1107098387 11364.3708 11929.98382 11979.24052 13818.31673 Critical Analysis -Exercise 2 14000.0 13000.0 12000.0 11000.0 10000.0 9000.0 when her heart beantworten har en tenden 8000.0 7000.0 6000.0 21 29 33 41 OORN 81 85 89 93 97 101 105 109 113 117 121 125 129 -Series 1 Series 2 000 Correlogram- Residual Errors (Winter's Exponential Smoothing) 0.25 0.2 0.15 0.1 0.05 11 acf 0 lower 1 2 3 4 5 6 7 8 9 101112131415161718192021222324252627282930 -0.05 2011 upper -0.1 -0.15 -0.2 -0.25 Jan-2010 8093.4 Feb-2010 7243.1 Mar-2010 8017.8 7835.6 Apr-2010 May-2010 Jun-2010 7887.6 7527.9 Jul-2010 8044.4 7924.7 7855.4 Aug-2010 Sep-2010 Oct-2010 Nov-2010 8239.5 8288.1 Dec-2010 9491.8 Jan-2011 8403.6 Feb-2011 7649.6 8285.0 8211.3 8059.0 7878.3 Mar-2011 Apr-2011 May-2011 Jun-2011 Jul-2011 Aug-2011 Sep-2011 Oct-2011 Nov-2011 8315.2 8360.3 8274.2 8606.3 8569.9 Dec-2011 9936.0 Jan-2012 8534.8 Feb-2012 8119.1 8736.6 8399.2 8450.7 8269.7 8500.4 Mar-2012 Apr-2012 May-2012 Jun-2012 Jul-2012 Aug-2012 Sep-2012 Oct-2012 Nov-2012 Dec-2012 Jan-2013 8787.9 8582.8 8982.0 9048.5 10262.1 9067.6 8264.8 Feb-2013 Mar-2013 9272.0 8614.9 8876.5 Apr-2013 May-2013 Jun-2013 Jul-2013 Aug-2013 8516.9 8855.8 9188.1 8839.1 Sep-2013 Oct-2013 Nov-2013 9338.4 9345.9 Dec-2013 10856.4 Jan-2014 9701.6 Feb-2014 8667.9 Mar-2014 9524.6 9223.9 Apr-2014 May-2014 9386.0 Jun-2014 8977.5 9393.3 9582.4 Jul-2014 Aug-2014 Sep-2014 Oct-2014 Nov-2014 9353.8 9964.4 9911.1 Dec-2014 11271.6 Jan-2015 9955.4 Feb-2015 9020.0 Mar-2015 9926.5 9538.0 Apr-2015 May-2015 Jun-2015 9707.1 9217.8 Jul-2015 9718.0 9834.8 9645.8 Aug-2015 Sep-2015 Oct-2015 Nov-2015 10319.2 10128.5 11731.2 Dec-2015 Jan-2016 10244.9 Feb-2016 9556.9 Mar-2016 10354.0 9727.9 Apr-2016 May-2016 9815.2 Jun-2016 9516.5 9928.5 10041.9 Jul-2016 Aug-2016 Sep-2016 Oct-2016 Nov-2016 10005.7 10482.6 10435.7 Dec-2016 12230.1 Jan-2017 10431.5 Feb-2017 9574.6 Mar-2017 10510.3 10274.1 10189.7 9857.6 10272.8 Apr-2017 May-2017 Jun-2017 Jul-2017 Aug-2017 Sep-2017 Oct-2017 Nov-2017 10363.7 10307.9 10710.9 10780.7 Dec-2017 12552.1 Jan-2018 10713.3 Feb-2018 9833.2 Mar-2018 11188.4 Apr-2018 May-2018 10354.1 10645.2 Jun-2018 10268.2 Jul-2018 10604.4 10852.2 10713.8 Aug-2018 Sep-2018 Oct-2018 Nov-2018 11126.1 11214.7 Dec-2018 13037.6 11253.8 Jan-2019 Feb-2019 10308.6 Mar-2019 11405.1 10964.8 Apr-2019 May-2019 11024.2 10587.6 10949.7 11294.6 Jun-2019 Jul-2019 Aug-2019 Sep-2019 Oct-2019 Nov-2019 10946.6 11565.4 11643.3 Dec-2019 13292.7 Jan-2020 Feb-2020 Mar-2020 Apr-2020 May-2020 Jun-2020 Jul-2020 Aug-2020 Sep-2020 Oct-2020 Nov-2020 8122.068214 7330.442004 8197.031057 8058.838658 8171.416163 7820.790201 8404.606177 8305.598869 8277.896274 8721.831858 8796.573493 10080.98029 8724.847451 7839.387649 8647.084733 8522.741264 8491.449208 8195.346196 8742.838738 8668.542923 8617.366084 9023.245493 9060.231073 10456.70663 9014.768904 8304.961064 9021.03196 8824.171714 8808.560528 8556.335553 8980.143401 9057.70774 8941.455721 9347.061845 9397.390639 10763.70553 9397.779675 8654.279125 9526.675247 9105.648534 9246.051487 8952.503252 9377.299102 9586.133423 9358.617456 9842.995748 9904.444536 11424.5558 10040.94992 9093.848798 9991.240022 9588.664424 9718.314442 9341.819769 9753.841777 9948.637349 9689.424868 10225.34026 10230.06037 11708.43773 10320.80731 9341.927466 10306.81675 9906.862635 10034.76292 9568.656131 10030.76263 10184.85831 9934.660337 10547.80197 10447.548 12016.61693 10571.86447 9666.011744 10536.35818 10021.26112 10187.96154 9801.653074 10270.67171 10427.93501 10265.71054 10841.61415 10751.32317 12461.43998 10820.55081 9912.120609 10835.57287 10465.63466 10491.47208 10135.69082 10611.84719 10750.05404 10650.52566 11187.53885 11172.48788 12980.98096 11200.53577 10294.79828 11449.28913 10833.46714 11003.98372 10612.0597 11034.38768 11213.18519 11093.21544 11572.72905 11604.90993 13485.35121 11606.36858 10644.25284 11808.8473 11243.66951 11353.90579 10924.96403 11335.40916 11592.12275 11364.3708 1107098387 11364.3708 11929.98382 11979.24052 13818.31673 Critical Analysis -Exercise 2 14000.0 13000.0 12000.0 11000.0 10000.0 9000.0 when her heart beantworten har en tenden 8000.0 7000.0 6000.0 21 29 33 41 OORN 81 85 89 93 97 101 105 109 113 117 121 125 129 -Series 1 Series 2 000 Correlogram- Residual Errors (Winter's Exponential Smoothing) 0.25 0.2 0.15 0.1 0.05 11 acf 0 lower 1 2 3 4 5 6 7 8 9 101112131415161718192021222324252627282930 -0.05 2011 upper -0.1 -0.15 -0.2 -0.25Step by Step Solution
There are 3 Steps involved in it
Step: 1

Get Instant Access to Expert-Tailored Solutions
See step-by-step solutions with expert insights and AI powered tools for academic success
Step: 2

Step: 3
Ace Your Homework with AI
Get the answers you need in no time with our AI-driven, step-by-step assistance
Get Started
Contemporary Labor Economics
Authors: Campbell McConnell, Stanley Brue, David Macpherson
9th Edition
0073375950, 9780073375953