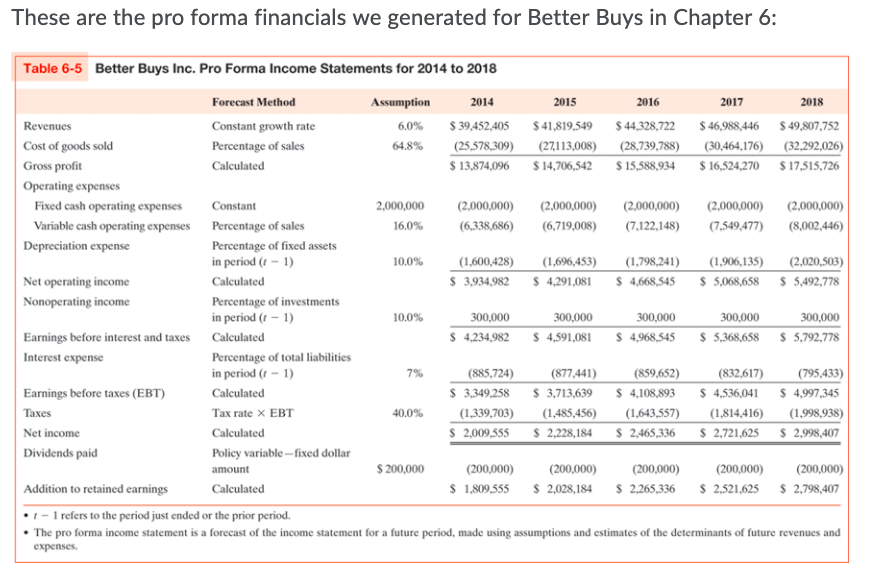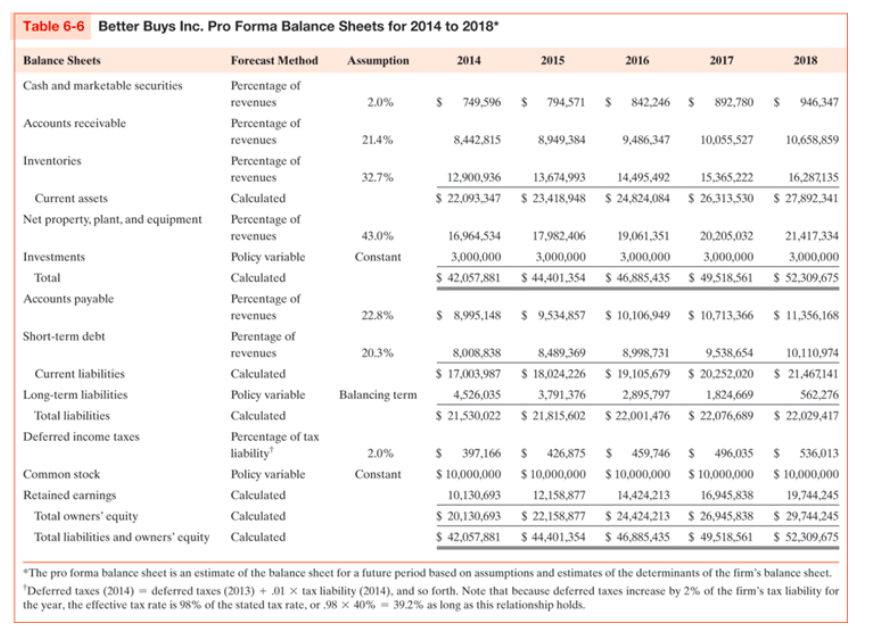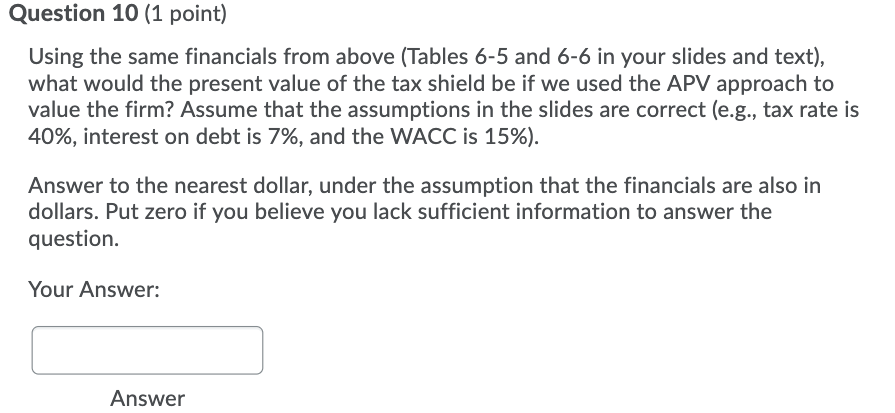


These are the pro forma financials we generated for Better Buys in Chapter 6: Table 6-5 Better Buys Inc. Pro Forma Income Statements for 2014 to 2018 Forecast Method Assumption 2014 2015 2016 2017 2018 Revenues 6.0% $ 39,452,405 $ 41,819,549 $ 44,328,722 $ 46,988,446 $ 49,807,752 Constant growth rate Percentage of sales Cost of goods sold 64.8% (25,578,309) (27,113,008) (28,739,788) (30,464,176) (32,292,026) $ 15,588,934 $ 16,524,270 $17,515,726 Gross profit Calculated $ 13,874,096 S14,706,542 Operating expenses 2,000,000 (2,000,000) (2,000,000) (2,000,000) (2,000,000) (2,000,000) (8,002,446) 16.0% (6,338,686) (6,719,008) (7,122,148) (7,549,477) Fixed cash operating expenses Constant Variable cash operating expenses Percentage of sales Depreciation expense Percentage of fixed assets in period (1 - 1) 10.0% (1,600,428) (1,696,453) $ 3,934,982 $ 4,291,081 (1,798,241) (1,906,135) (2,020,503) $ 4,668,545 $5,068,658 $ 5,492,778 Net operating income Calculated Nonoperating income Percentage of investments in period (1 - 1) 10.0% 300,000 300,000 300,000 $ 4,234,982 $4,591,081 300,000 300,000 $ 5,368,658 $5,792,778 Earnings before interest and taxes Calculated $ 4,968,545 Interest expense Percentage of total liabilities in period (1 - 1) 7% (885,724) (877,441) (859,652) (832,617) (795,433) $ 4.997,345 Earnings before taxes (EBT) Calculated $ 3,349,258 $ 3,713,639 $ 4,108,893 $ 4,536,041 Taxes Tax rate * EBT 40.0% (1,643,557) (1,814,416) (1,998,938) (1,339,703) (1,485,456) $ 2,009,555 $2,228,184 Net income Calculated $ 2,465,336 $ 2,721,625 $ 2,998,407 Dividends paid Policy variable fixed dollar amount $ 200,000 (200,000) (200,000) (200,000) (200,000) (200,000) Addition to retained earnings Calculated $ 1,809,555 $ 2,028,184 $ 2,265,336 $ 2,521,625 $ 2,798,407 - 1 refers to the period just ended or the prior period. The pro forma income statement is a forecast of the income statement for a future period, made using assumptions and estimates of the determinants of future revenues and expenses. Table 6-6 Better Buys Inc. Pro Forma Balance Sheets for 2014 to 2018* Balance Sheets Forecast Method Assumption 2014 2015 2016 2017 2018 Cash and marketable securities Percentage of revenues 2.0% $749,596 S 794,571 $ 842,246 $ 892,780 S 946,347 Accounts receivable Percentage of revenues 21.4% 8,442,815 8,949,384 9,486,347 10,055,527 10,658,859 Inventories Percentage of revenues 32.7% 12,900,936 13,674,993 14,495,492 15,365,222 16,287135 Current assets Calculated $ 22,093,347 $ 23,418,948 $ 24,824,084 $ 26,313,530 $ 27,892,341 Net property, plant, and equipment Percentage of revenues 43.0% 16,964,534 17,982,406 19,061,351 20,205,032 21,417,334 Investments Policy variable Constant 3,000,000 3,000,000 3,000,000 3,000,000 3,000,000 Total Calculated $ 42,057,881 S 44,401,354 $46,885,435 $ 49,518,561 $ 52,309,675 Accounts payable Percentage of revenues 22.8% $ 8,995,148 $ 9,534,857 $ 10,106,949 $ 10,713,366 $ 11,356,168 Short-term debt Perentage of revenues 20.3% 8,008,838 8,489,369 8,998,731 9,538,654 10,110,974 Current liabilities Calculated $ 17,003,987 $ 18,024,226 19,105,679 $ 20,252,020 $ 21,467141 Long-term liabilities Policy variable Balancing term 4,526,035 3,791,376 2,895,797 1,824,669 562,276 $ 21,530,022 $ 21,815,602 $ 22,001,476 $ 22,076,689 $ 22,029,417 Total liabilities Calculated Deferred income taxes 2.0% $ 397,166 $426,875 $ 459,746 $ 496,035 $ 536,013 Percentage of tax liability Policy variable Calculated Common stock Constant $ 10,000,000 $10,000,000 $10,000,000 $10,000,000 10,000,000 Retained earnings 12.158,877 14.424,213 16,945,838 Total owners' equity Calculated 10,130,693 19,744,245 $ 20,130,693 S 22,158,877 $ 24,424,213 $ 26,945,838 $ 29,744.245 $ 42,057,881 $ 44,401,354 $46,885,435 $ 49,518,561 $ 52,309,675 Total liabilities and owners' equity Calculated "The pro forma balance sheet is an estimate of the balance sheet for a future period based on assumptions and estimates of the determinants of the firm's balance sheet. Deferred taxes (2014) - deferred taxes (2013) +.01 X tax liability (2014), and so forth. Note that because deferred taxes increase by 2% of the firm's tax liability for the year, the effective tax rate is 98% of the stated tax rate, or 98 X 40% = 39.2% as long as this relationship holds. Question 10 (1 point) Using the same financials from above (Tables 6-5 and 6-6 in your slides and text), what would the present value of the tax shield be if we used the APV approach to value the firm? Assume that the assumptions in the slides are correct (e.g., tax rate is 40%, interest on debt is 7%, and the WACC is 15%). Answer to the nearest dollar, under the assumption that the financials are also in dollars. Put zero if you believe you lack sufficient information to answer the question. Your Answer: Answer These are the pro forma financials we generated for Better Buys in Chapter 6: Table 6-5 Better Buys Inc. Pro Forma Income Statements for 2014 to 2018 Forecast Method Assumption 2014 2015 2016 2017 2018 Revenues 6.0% $ 39,452,405 $ 41,819,549 $ 44,328,722 $ 46,988,446 $ 49,807,752 Constant growth rate Percentage of sales Cost of goods sold 64.8% (25,578,309) (27,113,008) (28,739,788) (30,464,176) (32,292,026) $ 15,588,934 $ 16,524,270 $17,515,726 Gross profit Calculated $ 13,874,096 S14,706,542 Operating expenses 2,000,000 (2,000,000) (2,000,000) (2,000,000) (2,000,000) (2,000,000) (8,002,446) 16.0% (6,338,686) (6,719,008) (7,122,148) (7,549,477) Fixed cash operating expenses Constant Variable cash operating expenses Percentage of sales Depreciation expense Percentage of fixed assets in period (1 - 1) 10.0% (1,600,428) (1,696,453) $ 3,934,982 $ 4,291,081 (1,798,241) (1,906,135) (2,020,503) $ 4,668,545 $5,068,658 $ 5,492,778 Net operating income Calculated Nonoperating income Percentage of investments in period (1 - 1) 10.0% 300,000 300,000 300,000 $ 4,234,982 $4,591,081 300,000 300,000 $ 5,368,658 $5,792,778 Earnings before interest and taxes Calculated $ 4,968,545 Interest expense Percentage of total liabilities in period (1 - 1) 7% (885,724) (877,441) (859,652) (832,617) (795,433) $ 4.997,345 Earnings before taxes (EBT) Calculated $ 3,349,258 $ 3,713,639 $ 4,108,893 $ 4,536,041 Taxes Tax rate * EBT 40.0% (1,643,557) (1,814,416) (1,998,938) (1,339,703) (1,485,456) $ 2,009,555 $2,228,184 Net income Calculated $ 2,465,336 $ 2,721,625 $ 2,998,407 Dividends paid Policy variable fixed dollar amount $ 200,000 (200,000) (200,000) (200,000) (200,000) (200,000) Addition to retained earnings Calculated $ 1,809,555 $ 2,028,184 $ 2,265,336 $ 2,521,625 $ 2,798,407 - 1 refers to the period just ended or the prior period. The pro forma income statement is a forecast of the income statement for a future period, made using assumptions and estimates of the determinants of future revenues and expenses. Table 6-6 Better Buys Inc. Pro Forma Balance Sheets for 2014 to 2018* Balance Sheets Forecast Method Assumption 2014 2015 2016 2017 2018 Cash and marketable securities Percentage of revenues 2.0% $749,596 S 794,571 $ 842,246 $ 892,780 S 946,347 Accounts receivable Percentage of revenues 21.4% 8,442,815 8,949,384 9,486,347 10,055,527 10,658,859 Inventories Percentage of revenues 32.7% 12,900,936 13,674,993 14,495,492 15,365,222 16,287135 Current assets Calculated $ 22,093,347 $ 23,418,948 $ 24,824,084 $ 26,313,530 $ 27,892,341 Net property, plant, and equipment Percentage of revenues 43.0% 16,964,534 17,982,406 19,061,351 20,205,032 21,417,334 Investments Policy variable Constant 3,000,000 3,000,000 3,000,000 3,000,000 3,000,000 Total Calculated $ 42,057,881 S 44,401,354 $46,885,435 $ 49,518,561 $ 52,309,675 Accounts payable Percentage of revenues 22.8% $ 8,995,148 $ 9,534,857 $ 10,106,949 $ 10,713,366 $ 11,356,168 Short-term debt Perentage of revenues 20.3% 8,008,838 8,489,369 8,998,731 9,538,654 10,110,974 Current liabilities Calculated $ 17,003,987 $ 18,024,226 19,105,679 $ 20,252,020 $ 21,467141 Long-term liabilities Policy variable Balancing term 4,526,035 3,791,376 2,895,797 1,824,669 562,276 $ 21,530,022 $ 21,815,602 $ 22,001,476 $ 22,076,689 $ 22,029,417 Total liabilities Calculated Deferred income taxes 2.0% $ 397,166 $426,875 $ 459,746 $ 496,035 $ 536,013 Percentage of tax liability Policy variable Calculated Common stock Constant $ 10,000,000 $10,000,000 $10,000,000 $10,000,000 10,000,000 Retained earnings 12.158,877 14.424,213 16,945,838 Total owners' equity Calculated 10,130,693 19,744,245 $ 20,130,693 S 22,158,877 $ 24,424,213 $ 26,945,838 $ 29,744.245 $ 42,057,881 $ 44,401,354 $46,885,435 $ 49,518,561 $ 52,309,675 Total liabilities and owners' equity Calculated "The pro forma balance sheet is an estimate of the balance sheet for a future period based on assumptions and estimates of the determinants of the firm's balance sheet. Deferred taxes (2014) - deferred taxes (2013) +.01 X tax liability (2014), and so forth. Note that because deferred taxes increase by 2% of the firm's tax liability for the year, the effective tax rate is 98% of the stated tax rate, or 98 X 40% = 39.2% as long as this relationship holds. Question 10 (1 point) Using the same financials from above (Tables 6-5 and 6-6 in your slides and text), what would the present value of the tax shield be if we used the APV approach to value the firm? Assume that the assumptions in the slides are correct (e.g., tax rate is 40%, interest on debt is 7%, and the WACC is 15%). Answer to the nearest dollar, under the assumption that the financials are also in dollars. Put zero if you believe you lack sufficient information to answer the question. Your


