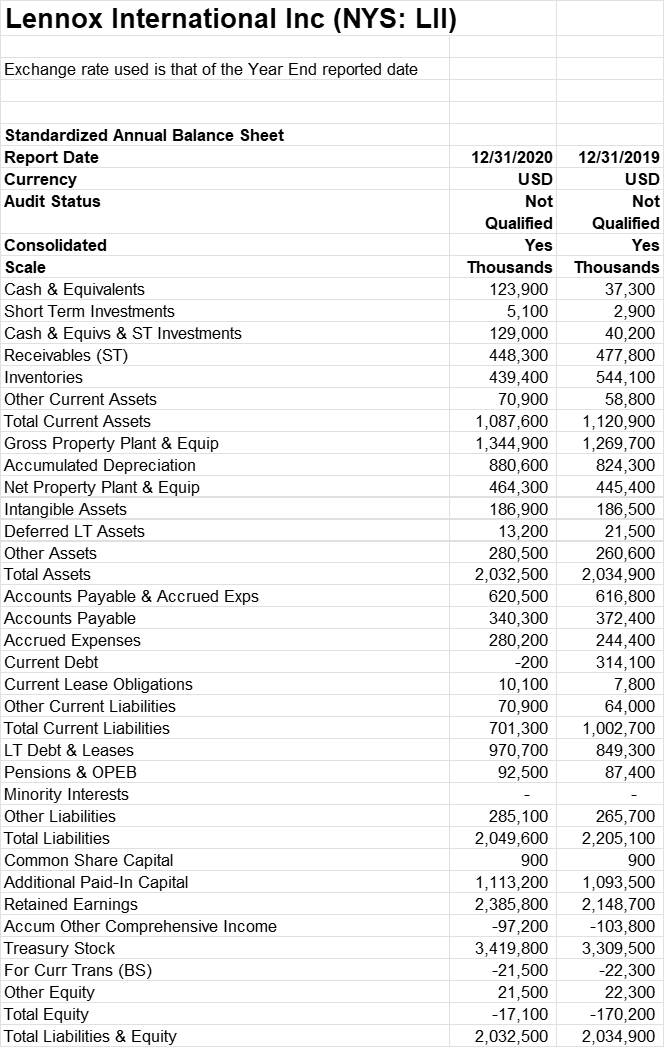
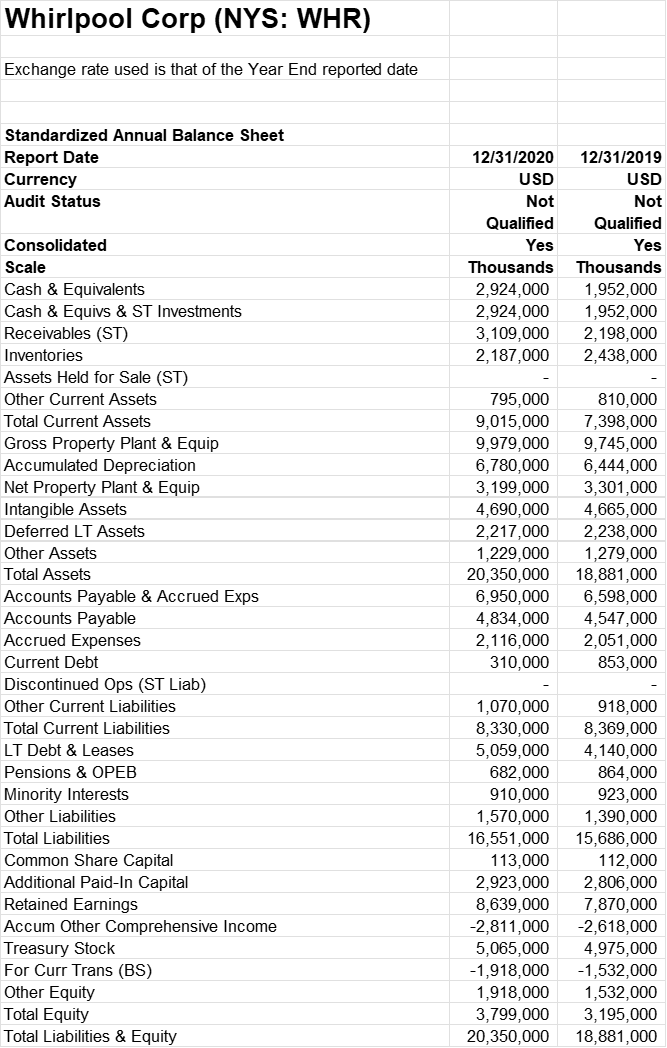
These two companies are selected for a financial analysis comparison. Discuss the data in below financial tables and show all your findings between these two companies. Anything financial related can be listed.


Lennox International Inc (NYS: LII) Exchange rate used is that of the Year End reported date Standardized Annual Balance Sheet Report Date Currency Audit Status 12/31/2019 USD Not Consolidated Scale Cash & Equivalents Short Term Investments Cash & Equivs & ST Investments Receivables (ST) Inventories Other Current Assets Total Current Assets Gross Property Plant & Equip Accumulated Depreciation Net Property Plant & Equip Intangible Assets Deferred LT Assets Other Assets Total Assets Accounts Payable & Accrued Exps Accounts Payable Accrued Expenses Current Debt Current Lease Obligations Other Current Liabilities Total Current Liabilities LT Debt & Leases Pensions & OPEB Minority Interests Other Liabilities Total Liabilities Common Share Capital Additional Paid-In Capital Retained Earnings Accum Other Comprehensive Income Treasury Stock For Curr Trans (BS) Other Equity Total Equity Total Liabilities & Equity 12/31/2020 USD Not Qualified Yes Thousands 123,900 5,100 129,000 448,300 439,400 70,900 1,087,600 1,344,900 880,600 464,300 186,900 13,200 280,500 2,032,500 620,500 340,300 280,200 -200 10,100 70,900 701,300 970,700 92,500 Qualified Yes Thousands 37,300 2,900 40,200 477,800 544,100 58,800 1,120,900 1,269, 700 824,300 445,400 186,500 21,500 260,600 2,034,900 616,800 372,400 244,400 314,100 7,800 64,000 1,002, 700 849,300 87,400 285,100 2,049,600 900 1,113,200 2,385,800 -97,200 3,419,800 -21,500 21,500 -17,100 2,032,500 265,700 2,205, 100 900 1,093,500 2,148,700 -103,800 3,309,500 -22,300 22,300 -170,200 2,034,900 Whirlpool Corp (NYS: WHR) Exchange rate used is that of the Year End reported date Standardized Annual Balance Sheet Report Date Currency Audit Status 12/31/2020 USD Not Qualified Yes Thousands 2,924,000 2,924,000 3,109,000 2,187,000 12/31/2019 USD Not Qualified Yes Thousands 1,952,000 1,952,000 2,198,000 2,438,000 Consolidated Scale Cash & Equivalents Cash & Equivs & ST Investments Receivables (ST) Inventories Assets Held for Sale (ST) Other Current Assets Total Current Assets Gross Property Plant & Equip Accumulated Depreciation Net Property Plant & Equip Intangible Assets Deferred LT Assets Other Assets Total Assets Accounts Payable & Accrued Exps Accounts Payable Accrued Expenses Current Debt Discontinued Ops (ST Liab) Other Current Liabilities Total Current Liabilities LT Debt & Leases Pensions & OPEB Minority Interests Other Liabilities Total Liabilities Common Share Capital Additional Paid-In Capital Retained Earnings Accum Other Comprehensive Income Treasury Stock For Curr Trans (BS) Other Equity Total Equity Total Liabilities & Equity 795,000 9,015,000 9,979,000 6,780,000 3,199,000 4,690,000 2,217,000 1,229,000 20,350,000 6,950,000 4,834,000 2,116,000 310,000 810,000 7,398,000 9,745,000 6,444,000 3,301,000 4,665,000 2,238,000 1,279,000 18,881,000 6,598,000 4,547,000 2,051,000 853,000 1,070,000 8,330,000 5,059,000 682,000 910,000 1,570,000 16,551,000 113,000 2,923,000 8,639,000 -2,811,000 5,065,000 -1,918,000 1,918,000 3,799,000 20,350,000 918,000 8,369,000 4,140,000 864,000 923,000 1,390,000 15,686,000 112,000 2,806,000 7,870,000 -2,618,000 4,975,000 -1,532,000 1,532,000 3,195,000 18,881,000 Lennox International Inc (NYS: LII) Exchange rate used is that of the Year End reported date Standardized Annual Balance Sheet Report Date Currency Audit Status 12/31/2019 USD Not Consolidated Scale Cash & Equivalents Short Term Investments Cash & Equivs & ST Investments Receivables (ST) Inventories Other Current Assets Total Current Assets Gross Property Plant & Equip Accumulated Depreciation Net Property Plant & Equip Intangible Assets Deferred LT Assets Other Assets Total Assets Accounts Payable & Accrued Exps Accounts Payable Accrued Expenses Current Debt Current Lease Obligations Other Current Liabilities Total Current Liabilities LT Debt & Leases Pensions & OPEB Minority Interests Other Liabilities Total Liabilities Common Share Capital Additional Paid-In Capital Retained Earnings Accum Other Comprehensive Income Treasury Stock For Curr Trans (BS) Other Equity Total Equity Total Liabilities & Equity 12/31/2020 USD Not Qualified Yes Thousands 123,900 5,100 129,000 448,300 439,400 70,900 1,087,600 1,344,900 880,600 464,300 186,900 13,200 280,500 2,032,500 620,500 340,300 280,200 -200 10,100 70,900 701,300 970,700 92,500 Qualified Yes Thousands 37,300 2,900 40,200 477,800 544,100 58,800 1,120,900 1,269, 700 824,300 445,400 186,500 21,500 260,600 2,034,900 616,800 372,400 244,400 314,100 7,800 64,000 1,002, 700 849,300 87,400 285,100 2,049,600 900 1,113,200 2,385,800 -97,200 3,419,800 -21,500 21,500 -17,100 2,032,500 265,700 2,205, 100 900 1,093,500 2,148,700 -103,800 3,309,500 -22,300 22,300 -170,200 2,034,900 Whirlpool Corp (NYS: WHR) Exchange rate used is that of the Year End reported date Standardized Annual Balance Sheet Report Date Currency Audit Status 12/31/2020 USD Not Qualified Yes Thousands 2,924,000 2,924,000 3,109,000 2,187,000 12/31/2019 USD Not Qualified Yes Thousands 1,952,000 1,952,000 2,198,000 2,438,000 Consolidated Scale Cash & Equivalents Cash & Equivs & ST Investments Receivables (ST) Inventories Assets Held for Sale (ST) Other Current Assets Total Current Assets Gross Property Plant & Equip Accumulated Depreciation Net Property Plant & Equip Intangible Assets Deferred LT Assets Other Assets Total Assets Accounts Payable & Accrued Exps Accounts Payable Accrued Expenses Current Debt Discontinued Ops (ST Liab) Other Current Liabilities Total Current Liabilities LT Debt & Leases Pensions & OPEB Minority Interests Other Liabilities Total Liabilities Common Share Capital Additional Paid-In Capital Retained Earnings Accum Other Comprehensive Income Treasury Stock For Curr Trans (BS) Other Equity Total Equity Total Liabilities & Equity 795,000 9,015,000 9,979,000 6,780,000 3,199,000 4,690,000 2,217,000 1,229,000 20,350,000 6,950,000 4,834,000 2,116,000 310,000 810,000 7,398,000 9,745,000 6,444,000 3,301,000 4,665,000 2,238,000 1,279,000 18,881,000 6,598,000 4,547,000 2,051,000 853,000 1,070,000 8,330,000 5,059,000 682,000 910,000 1,570,000 16,551,000 113,000 2,923,000 8,639,000 -2,811,000 5,065,000 -1,918,000 1,918,000 3,799,000 20,350,000 918,000 8,369,000 4,140,000 864,000 923,000 1,390,000 15,686,000 112,000 2,806,000 7,870,000 -2,618,000 4,975,000 -1,532,000 1,532,000 3,195,000 18,881,000


