

Question
Thia is an annual report of an Agricultural Marketing Company.Now answer the questions through the pictures. What type of business is this? Provide some insights.
Thia is an annual report of an Agricultural Marketing Company.Now answer the questions through the pictures.
What type of business is this? Provide some insights. Provide a discussion on the operation/activities of the business Who are the users of the accounting information of this business. What are the main Property, Plant and Equipment listed in the assigned company annual report? Do you think the valuation of inventory requires subjective judgements? Why or why not? (3 marks) What are the different administrative expenses and selling, marketing and Distribution expenses reported by the assigned company in its annual report? How much has it increased or decreased from last year? What is the main reason for this increase or decrease? (4 marks) What are the main source of income for the business? (2 marks) What are the different components of the payment/perquisites to Managers and Directors
.
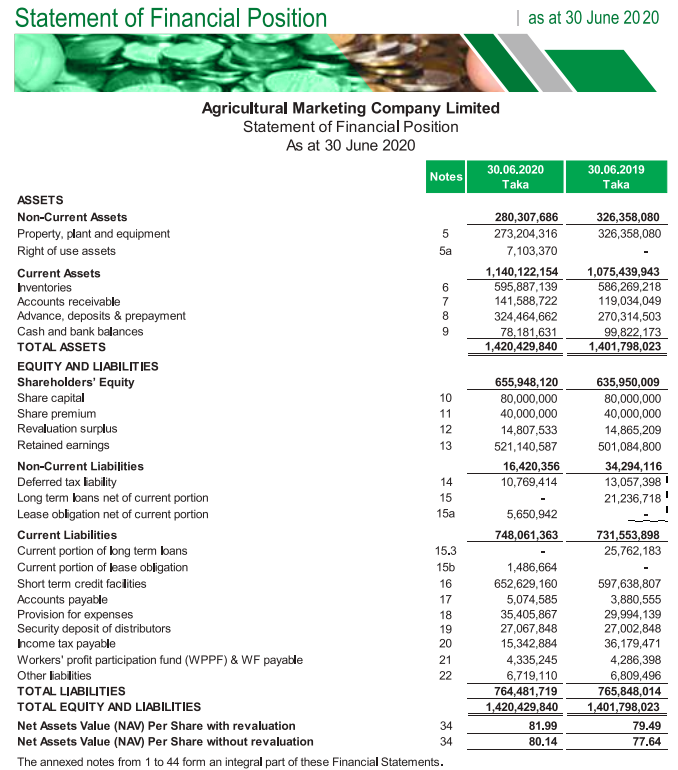
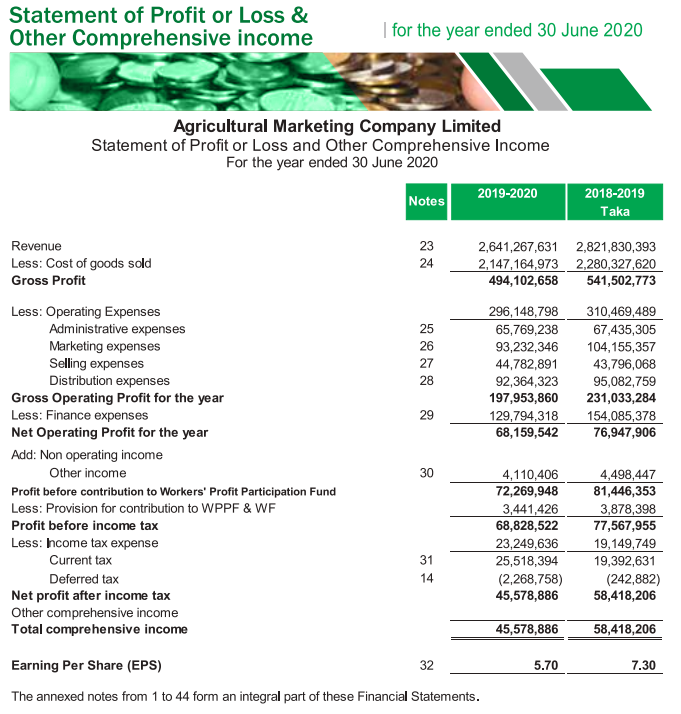
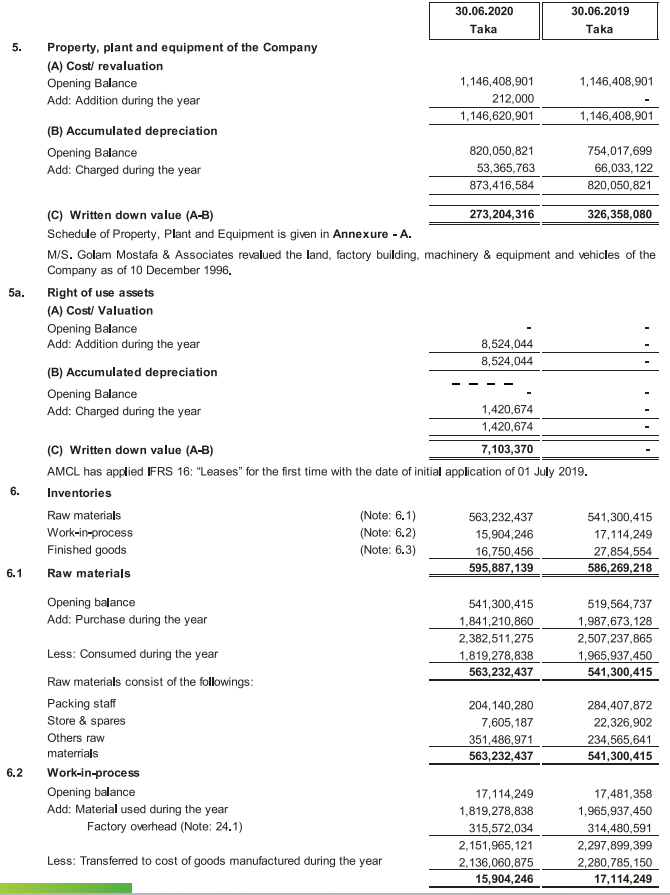
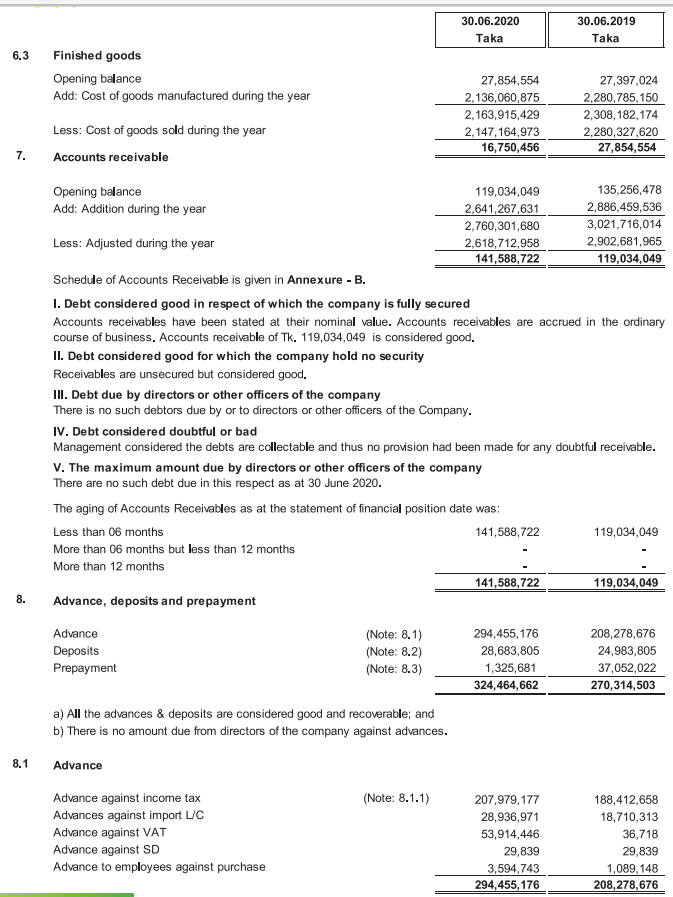
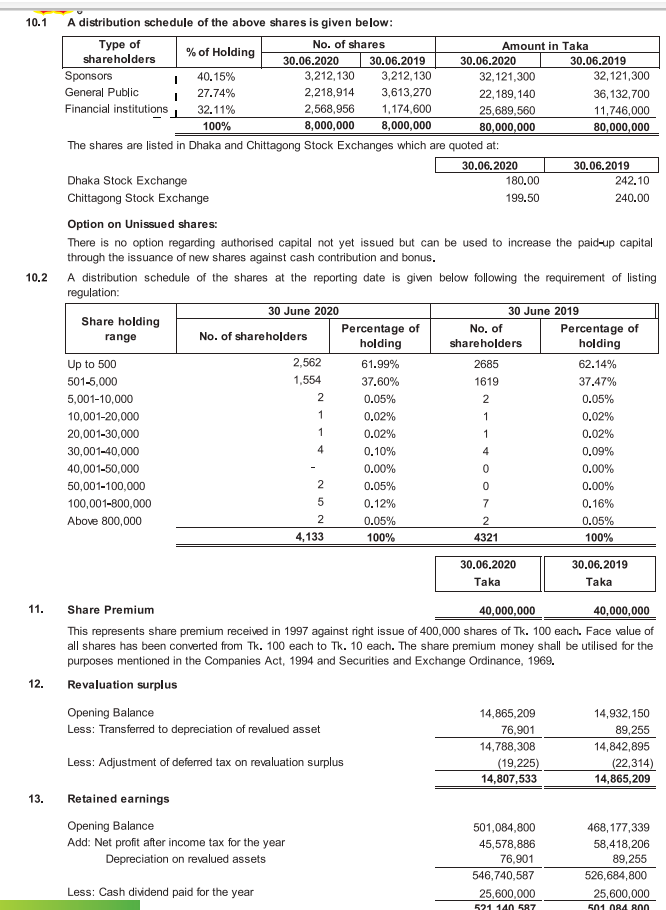
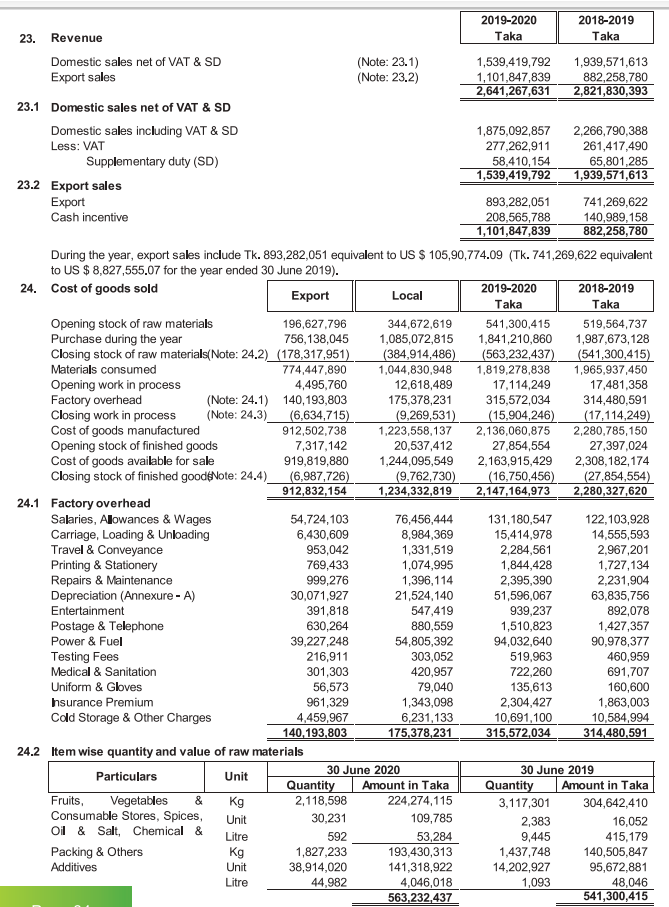
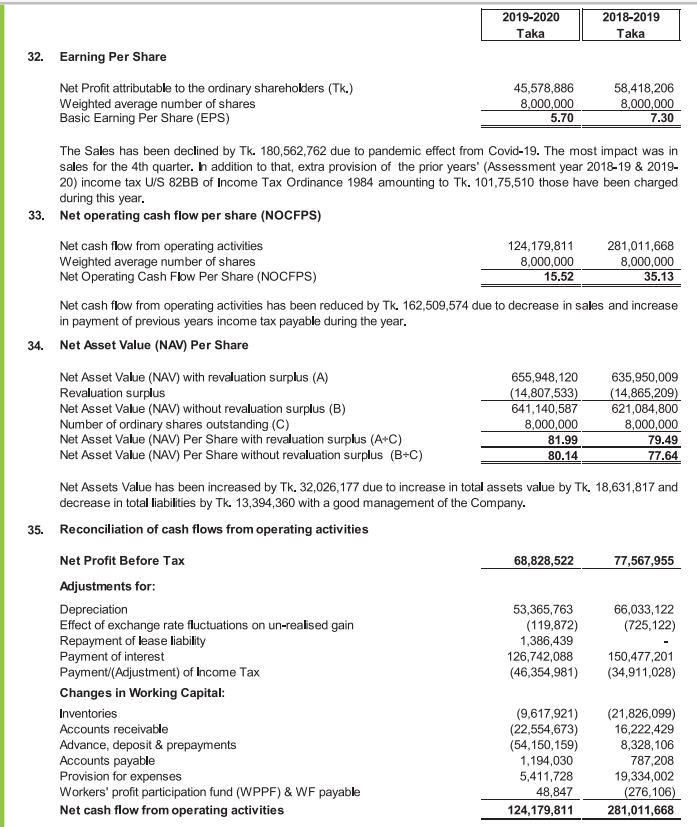
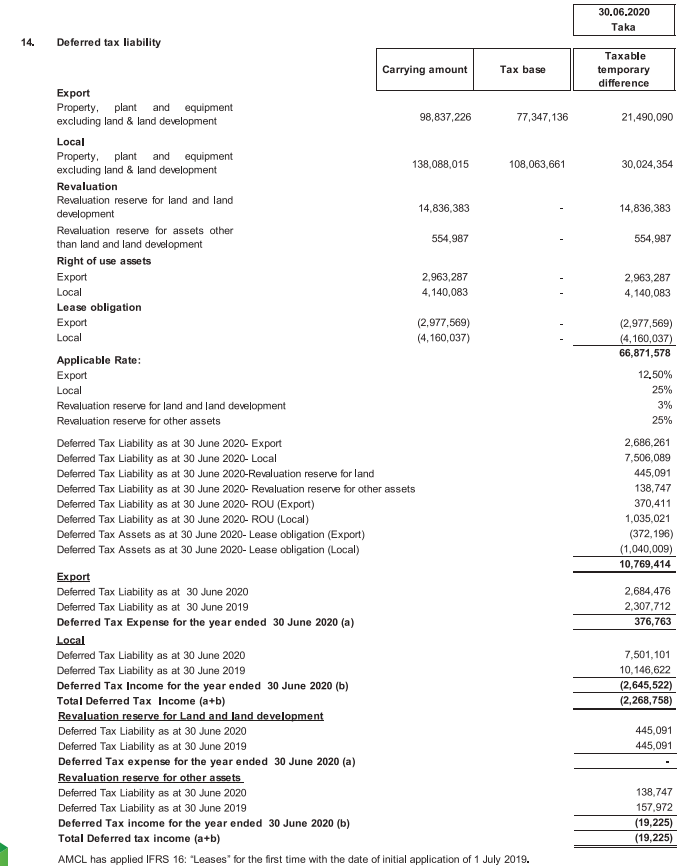
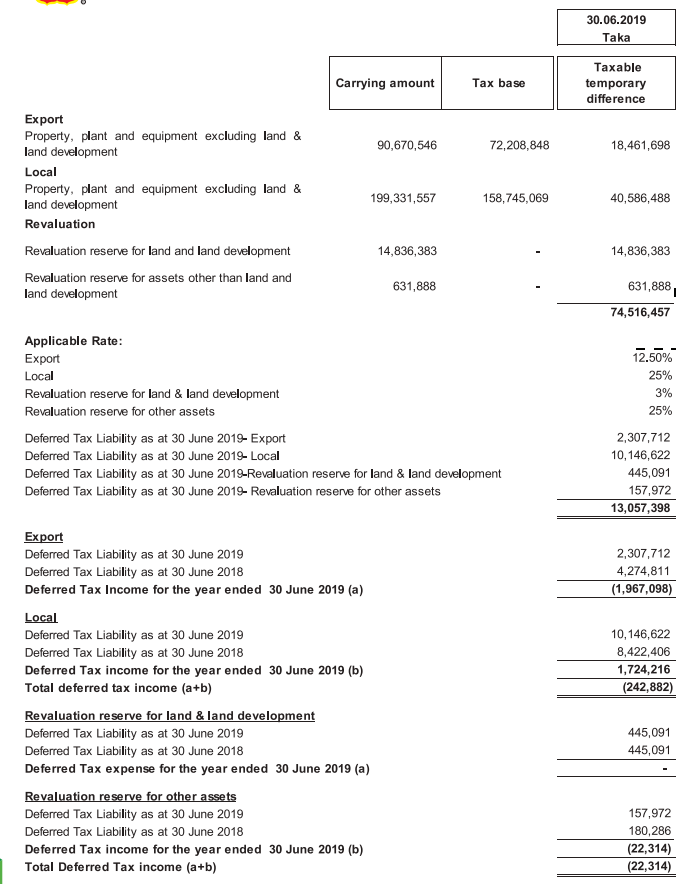
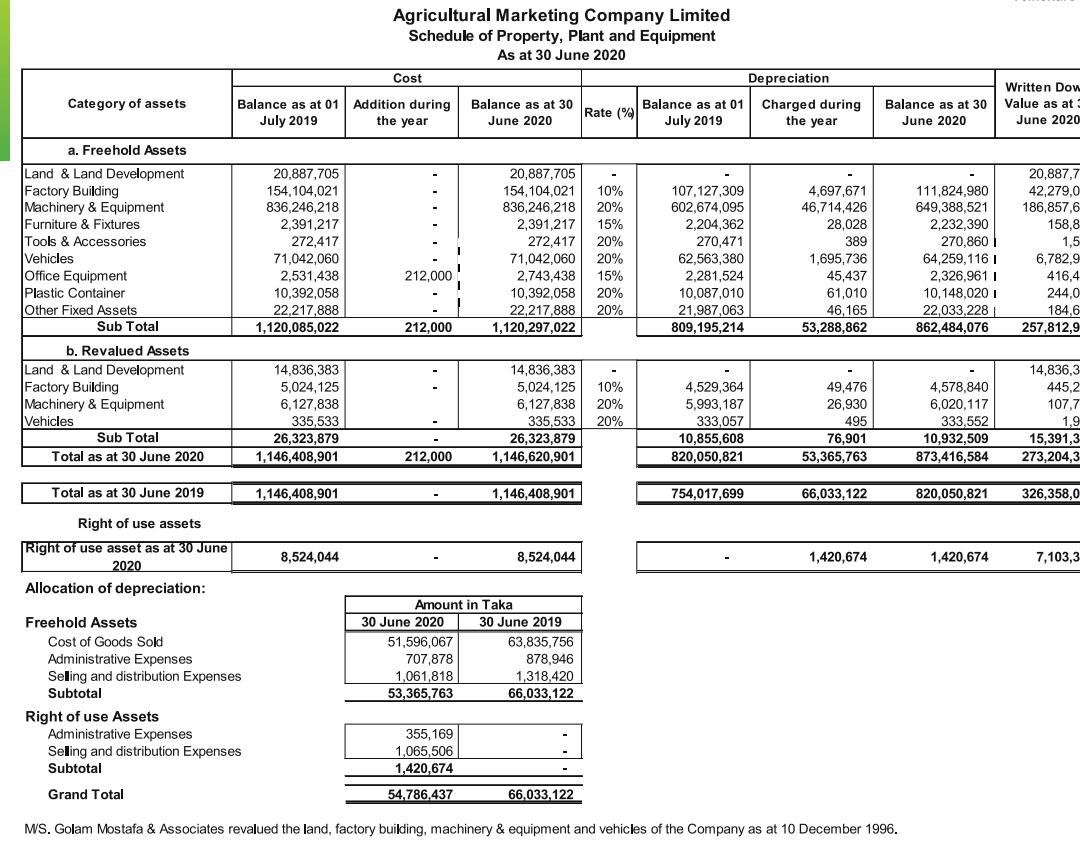
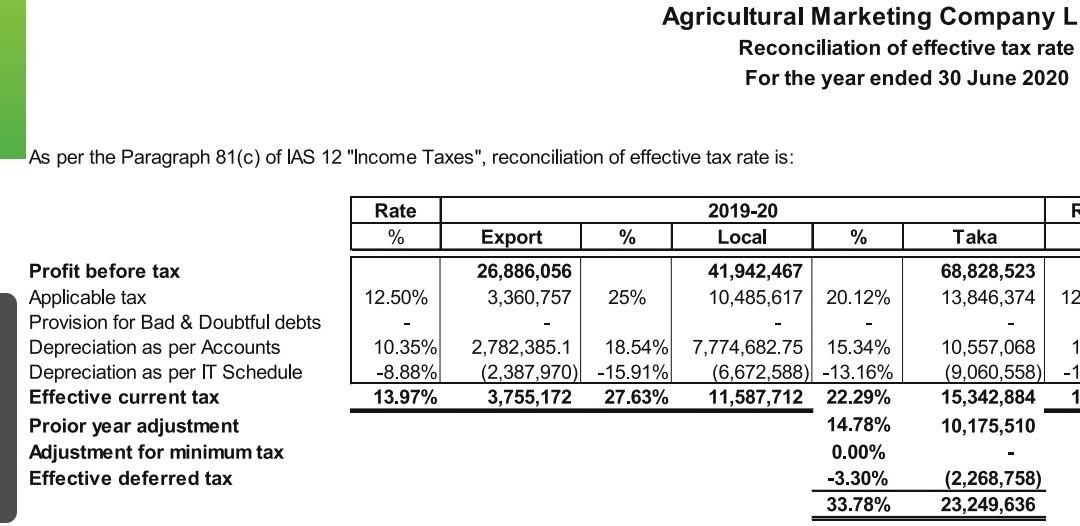
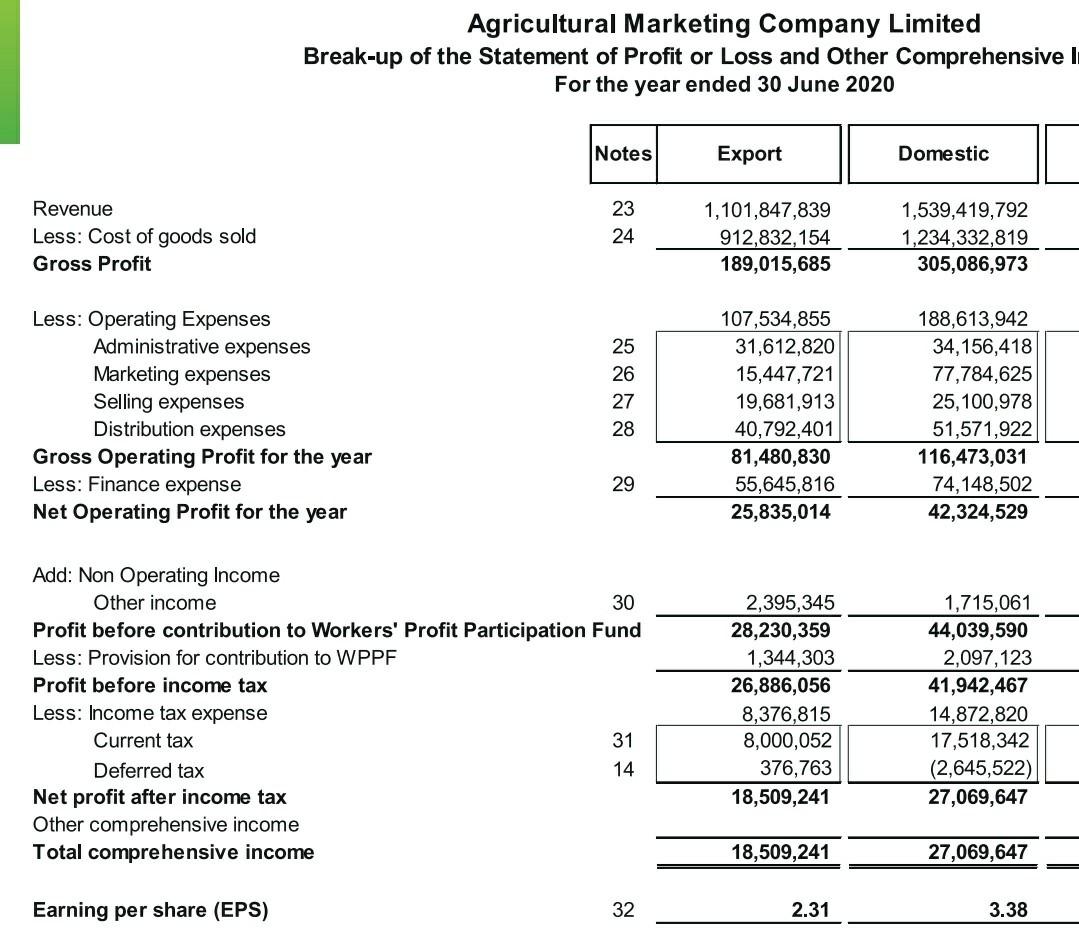
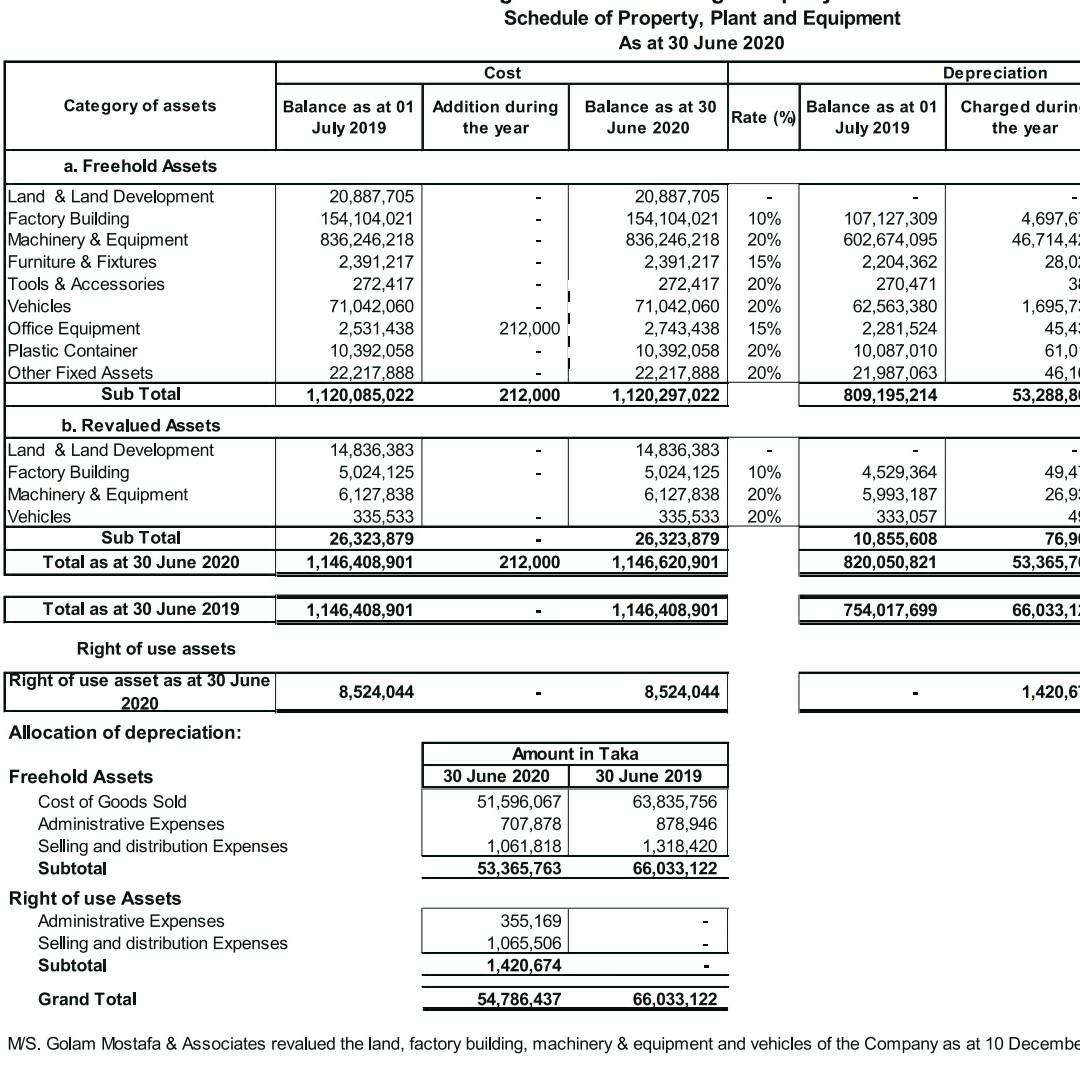
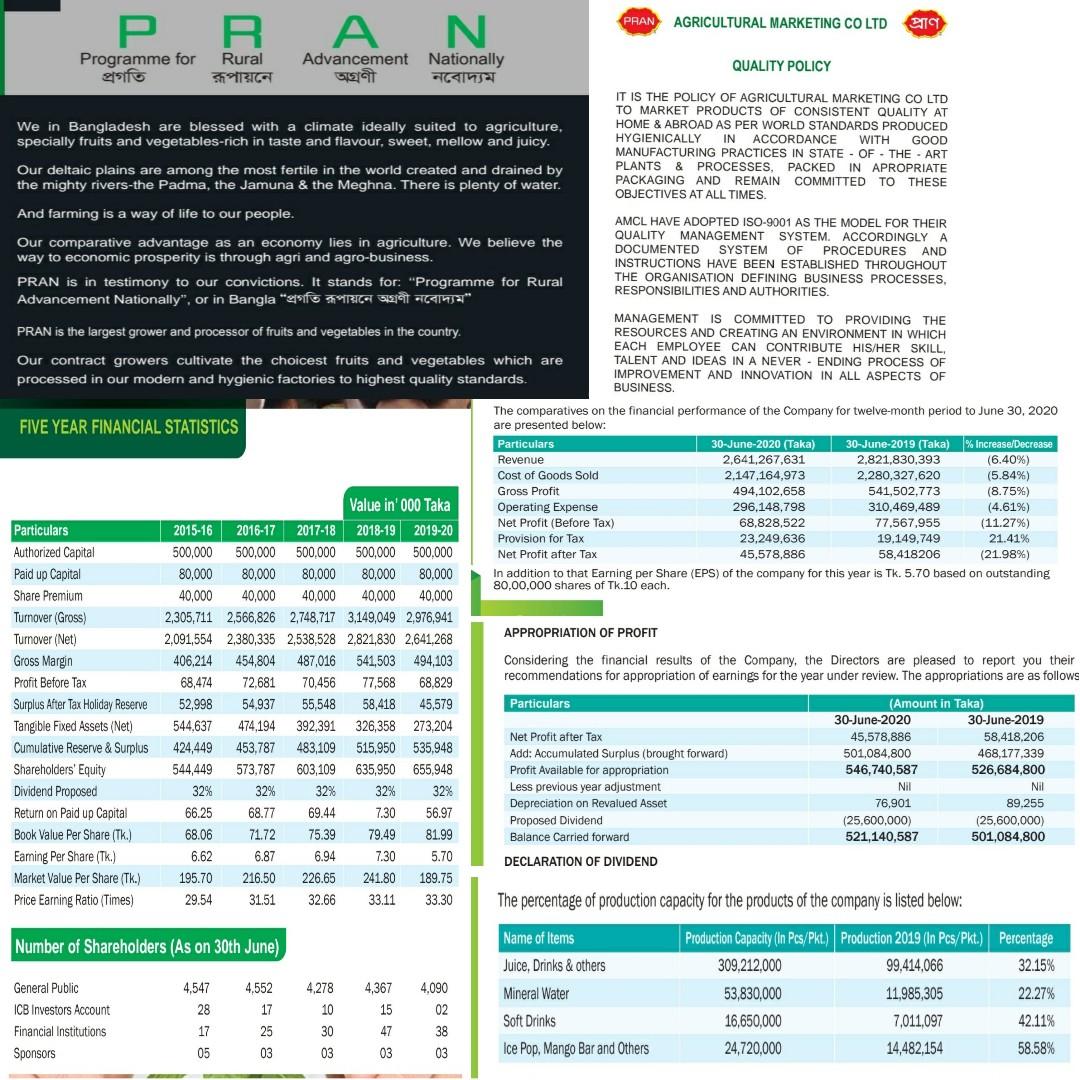
PRAN AGRICULTURAL MARKETING CO LTD PR A N Programme for Rural Advancement Nationally QUALITY POLICY We in Bangladesh are blessed with a climate ideally suited to agriculture, specially fruits and vegetables-rich in taste and flavour, sweet, mellow and juicy. IT IS THE POLICY OF AGRICULTURAL MARKETING CO LTD TO MARKET PRODUCTS OF CONSISTENT QUALITY AT HOME & ABROAD AS PER WORLD STANDARDS PRODUCED HYGIENICALLY IN ACCORDANCE WITH GOOD MANUFACTURING PRACTICES IN STATE-OF-THE-ART PLANTS & PROCESSES, PACKED IN APROPRIATE PACKAGING AND REMAIN COMMITTED TO THESE OBJECTIVES AT ALL TIMES. Our deltaic plains are among the most fertile in the world created and drained by the mighty rivers-the Padma, the Jamuna & the Meghna. There is plenty of water. And farming is a way of life to our people. Our comparative advantage as an economy lies in agriculture. We believe the way to economic prosperity is through agri and agro-business. PRAN is in testimony to our convictions. It stands for: "Programme for Rural Advancement Nationally, or in Bangla " AMCL HAVE ADOPTED ISO-9001 AS THE MODEL FOR THEIR QUALITY MANAGEMENT SYSTEM. ACCORDINGLY A DOCUMENTED SYSTEM OF PROCEDURES AND INSTRUCTIONS HAVE BEEN ESTABLISHED THROUGHOUT THE ORGANISATION DEFINING BUSINESS PROCESSES, RESPONSIBILITIES AND AUTHORITIES. PRAN is the largest grower and processor of fruits and vegetables in the country. Our contract growers cultivate the choicest fruits and vegetables which are processed in our modern and hygienic factories to highest quality standards. MANAGEMENT IS COMMITTED TO PROVIDING THE RESOURCES AND CREATING AN ENVIRONMENT IN WHICH EACH EMPLOYEE CAN CONTRIBUTE HIS/HER SKILL, TALENT AND IDEAS IN A NEVER - ENDING PROCESS OF IMPROVEMENT AND INNOVATION IN ALL ASPECTS OF BUSINESS. FIVE YEAR FINANCIAL STATISTICS The comparatives on the financial performance of the Company for twelve-month period to June 30, 2020 are presented below: Particulars 30-June-2020 (Taka) 30-June-2019 (Taka) % Increase/Decrease Revenue 2,641,267,631 2,821,830,393 (6.40%) Cost tof Goods Sold 2,147,164,973 2,280,327,620 (5.84%) Gross Profit 494,102,658 541,502.773 (8.75%) Operating Expense 296,148,798 310,469,489 (4.61%) Net Profit (Before Tax) 68,828,522 77,567,955 (11.27%) Provision for Tax 23,249,636 19.149.749 21.41% Net Profit after Tax 45,578,886 58,418206 (21.98%) In addition to that Earning per Share (EPS) of the company for this year is Tk. 5.70 based on outstanding 80,00.000 shares of Tk.10 each. APPROPRIATION OF PROFIT Considering the financial results of the Company, the Directors are pleased to report you their recommendations for appropriation of earnings for the year under review. The appropriations are as follows Particulars Authorized Capital Paid up Capital Share Premium Turnover (Gross) Turnover (Net) Gross Margin Profit Before Tax Surplus After Tax Holiday Reserve Tangible Fixed Assets (Net) Cumulative Reserve & Surplus Shareholders' Equity Dividend Proposed Return on Paid up Capital Book Value Per Share (Tk.) Eaming Per Share (Tk.) Market Value Per Share (TK.) Price Earning Ratio (Times) Value in' 000 Taka 2015-16 2016-17 2017-18 2018-19 2019-20 500,000 500,000 500.000 500,000 500.000 80,000 80,000 80,000 80,000 80.000 40,000 40,000 40,000 40,000 40.000 2,305,711 2,566,826 2,748,717 3.149,049 2.976.941 2,091,554 2,380,335 2,538,528 2,821,830 2.641,268 406,214 454,804 487,016 541,503 494,103 68,474 72.681 70,456 77,568 68.829 52,998 54,937 55,548 58,418 45,579 544.637 474,194 392,391 326,358 273,204 424,449 453,787 483,109 515,950 535.948 544,449 573,787 603,109 635,950 655,948 32% 32% 32% 32% 32% 66.25 68.77 69.44 7.30 56.97 68.06 71.72 75.39 79.49 81.99 6.62 6.87 6.94 7.30 5.70 195.70 216.50 226.65 241.80 189.75 29.54 31.51 32.66 33.11 33.30 Particulars Net Profit after Tax Add: Accumulated Surplus (brought forward) Profit Available for appropriation Less previous year adjustment Depreciation on Revalued Asset Proposed Dividend Balance Carried forward DECLARATION OF DIVIDEND (Amount in Taka) 30-June-2020 30-June-2019 45,578,886 58,418,206 501,084,800 468,177,339 546,740,587 526,684,800 Nil Nil 76,901 89.255 (25,600,000) (25,600,000) 521,140,587 501,084,800 The percentage of production capacity for the products of the company is listed below: Name of Items Number of Shareholders (As on 30th June) Juice Drinks & others 4,547 4.552 17 4,367 15 4.090 02 Mineral Water 4.278 10 30 General Public ICB Investors Account Financial Institutions Sponsors 28 Production Capacity (In Pcs/Pkt.) Production 2019 (In Pcs/Pkt.) Percentage 309.212.000 99.414.066 32.15% 53,830,000 11,985,305 22.27% 16,650,000 7,011,097 42.11% 24,720,000 14,482,154 58.58% Soft Drinks 17 25 47 38 05 03 03 03 03 Ice Pop, Mango Bar and Others Statement of Financial Position | as at 30 June 20 20 30.06.2019 Taka 326,358,080 326,358,080 5a 6 1,075,439,943 586,269,218 119,034,049 270,314,503 99,822,173 1,401,798,023 8 9 Agricultural Marketing Company Limited Statement of Financial Position As at 30 June 2020 Notes 30.06.2020 Taka ASSETS Non-Current Assets 280,307,686 Property, plant and equipment 5 273,204,316 Right of use assets 7,103,370 Current Assets 1,140,122,154 Inventories 595,887,139 Accounts receivable 7 141,588,722 Advance, deposits & prepayment 324,464,662 Cash and bank balances 78,181,631 TOTAL ASSETS 1,420,429,840 EQUITY AND LIABILITIES Shareholders' Equity 655,948,120 Share capital 10 80,000,000 Share premium 11 40,000,000 Revaluation surplus 12 14,807,533 Retained earnings 13 521,140,587 Non-Current Liabilities 16,420,356 Deferred tax lability 10,769,414 Long term bans net of current portion 15 Lease obligation net of current portion 15a 5,650,942 Current Liabilities 748,061,363 Current portion of long term loans 15.3 Current portion of lease obligation 15b 1,486,664 Short term credit facilities 16 652,629,160 Accounts payable 17 5,074,585 Provision for expenses 35,405,867 Security deposit of distributors 19 27,067,848 hcome tax payable 20 15,342,884 Workers' profit participation fund (WPPF) & WF payable 21 4,335,245 Other liabilities 6.719,110 TOTAL LIABILITIES 764,481,719 TOTAL EQUITY AND LIABILITIES 1,420,429,840 Net Assets Value (NAV) Per Share with revaluation 81.99 Net Assets Value (NAV) Per Share without revaluation 34 80.14 The annexed notes from 1 to 44 form an integral part of these Financial Statements. 635,950,009 80,000,000 40,000,000 14,865,209 501,084,800 34,294,116 13,057,3981 21,236,718' 14 731,553,898 25,762,183 18 597,638,807 3,880,555 29,994,139 27,002,848 36,179,471 4,286,398 6,809,496 765,848,014 1,401,798,023 79.49 77.64 22 34 Statement of Profit or Loss & Other Comprehensive income | for the year ended 30 June 2020 Agricultural Marketing Company Limited Statement of Profit or Loss and Other Comprehensive Income For the year ended 30 June 2020 Notes 2019-2020 2018-2019 Taka Revenue Less: Cost of goods sold Gross Profit 23 24 2,641,267,631 2,821,830,393 2,147,164,973 2,280,327,620 494,102,658 541,502,773 25 26 27 28 296, 148,798 65,769,238 93,232,346 44,782,891 92,364,323 197,953,860 129,794,318 68,159,542 310,469,489 67,435,305 104,155,357 43,796,068 95,082,759 231,033,284 154,085,378 76,947,906 29 Less: Operating Expenses Administrative expenses Marketing expenses Selling expenses Distribution expenses Gross Operating Profit for the year Less: Finance expenses Net Operating Profit for the year Add: Non operating income Other income Profit before contribution to Workers' Profit Participation Fund Less: Provision for contribution to WPPF & WF Profit before income tax Less: Income tax expense Current tax Deferred tax Net profit after income tax Other comprehensive income Total comprehensive income 30 4,110,406 72,269,948 3,441,426 68,828,522 23,249,636 25,518,394 (2,268,758) 45,578,886 4,498,447 81,446,353 3,878,398 77,567,955 19,149,749 19,392,631 (242,882) 58,418,206 31 14 45,578,886 58,418,206 5.70 7.30 Earning Per Share (EPS) 32 The annexed notes from 1 to 44 form an integral part of these Financial Statements. 30.06.2020 Taka 30.06.2019 Taka . 5. 1,146,408,901 Property, plant and equipment of the Company (A) Cost/ revaluation Opening Balance Add: Addition during the year (B) Accumulated depreciation Opening Balance Add: Charged during the year 1,146,408,901 212,000 1,146,620,901 1,146,408,901 820,050,821 53,365,763 873,416,584 754,017,699 66,033,122 820,050,821 5a. 6. (C) Written down value (A-B) 273,204,316 326,358,080 Schedule of Property, Plant and Equipment is given in Annexure - A. M/S. Golam Mostafa & Associates revalued the land, factory building, machinery & equipment and vehicles of the Company as of 10 December 1996. Right of use assets (A) Cost/ Valuation Opening Balance Add: Addition during the year 8,524,044 8,524,044 (B) Accumulated depreciation Opening Balance Add: Charged during the year 1,420,674 1,420,674 (C) Written down value (A-B) 7,103,370 AMCL has applied IFRS 16: "Leases" for the first time with the date of initial application of 01 July 2019. Inventories Raw materials (Note: 6.1) 563,232,437 541,300,415 Work-in-process (Note: 6.2) 15,904,246 17,114,249 Finished goods (Note: 6.3) 16,750,456 27,854,554 Raw materials 595,887,139 586,269,218 Opening balance 541,300,415 519,564,737 Add: Purchase during the year 1,841,210,860 1,987,673,128 2,382,511,275 2,507,237,865 Less: Consumed during the year 1,819,278,838 1,965,937,450 563, 232,437 541,300,415 Raw materials consist of the followings: Packing staff 204,140,280 284,407,872 Store & Spares 7,605,187 22,326,902 Others raw 351,486,971 234,565,641 materials 563,232,437 541,300,415 Work-in-process Opening balance 17,114,249 17,481,358 Add: Material used during the year 1,819,278,838 1,965,937,450 Factory overhead (Note: 24.1) 315,572,034 314,480,591 2,151,965, 121 2,297,899,399 Less: Transferred to cost of goods manufactured during the year 2,136,060,875 2,280,785,150 15,904,246 17,114,249 6.1 6.2 30.06.2020 Taka 30.06.2019 Taka 6.3 Finished goods Opening balance Add: Cost of goods manufactured during the year 27,854,554 2,136,060,875 2,163,915,429 2,147,164,973 16,750,456 27,397,024 2,280,785,150 2,308,182,174 2,280,327,620 27,854,554 Less: Cost of goods sold during the year Accounts receivable 7. Opening balance 119,034,049 135,256,478 Add: Addition during the year 2,641,267,631 2,886,459,536 2,760,301,680 3,021,716,014 Less: Adjusted during the year 2,618,712,958 2,902,681,965 141,588,722 119,034,049 Schedule of Accounts Receivable is given in Annexure - B. I. Debt considered good in respect of which the company is fully secured Accounts receivables have been stated at their nominal value. Accounts receivables are accrued in the ordinary course of business. Accounts receivable of Tk. 119,034,049 is considered good. II. Debt considered good for which the company hold no security Receivables are unsecured but considered good. III. Debt due by directors or other officers of the company There is no such debtors due by or to directors or other officers of the Company. IV. Debt considered doubtful or bad Management considered the debts are collectable and thus no provision had been made for any doubtful receivable. V. The maximum amount due by directors or other officers of the company There are no such debt due in this respect as at 30 June 2020. The aging of Accounts Receivables as at the statement of financial position date was: Less than 06 months 141,588,722 119,034,049 More than 06 months but less than 12 months More than 12 months 141,588,722 119,034,049 Advance, deposits and prepayment 8. Advance Deposits Prepayment (Note: 8.1) (Note: 8.2) (Note: 8.3) 294,455,176 28,683,805 1,325,681 324,464,662 208,278,676 24,983,805 37,052,022 270,314,503 a) All the advances & deposits are considered good and recoverable; and b) There is no amount due from directors of the company against advances. 8.1 Advance (Note: 8.1.1) Advance against income tax Advances against import LIC Advance against VAT Advance against SD Advance to employees against purchase 207,979,177 28,936,971 53,914,446 29,839 3,594,743 294,455,176 188,412,658 18,710,313 36,718 29,839 1,089,148 208,278,676 10.1 10.2 A distribution schedule of the above shares is given below: Type of No. of shares Amount in Taka shareholders % of Holding 30.06.2020 30.06.2019 30.06.2020 30.06.2019 Sponsors 1 40.15% 3,212,130 3,212,130 32,121,300 32,121,300 General Public I 27.74% 2,218,914 3,613,270 22,189,140 36, 132,700 Financial institutions 32.11% 2,568,956 1,174,600 25,689,560 11,746,000 100% 8,000,000 8,000,000 80,000,000 80,000,000 The shares are listed in Dhaka and Chittagong Stock Exchanges which are quoted at: 30.06.2020 30.06.2019 Dhaka Stock Exchange 180.00 242.10 Chittagong Stock Exchange 199.50 240.00 Option on Unissued shares: There is no option regarding authorised capital not yet issued but can be used to increase the paid-up capital through the issuance of new shares against cash contribution and bonus. A distribution schedule of the shares at the reporting date is given below following the requirement of listing regulation: 30 June 2020 30 June 2019 Share holding Percentage of No. of shareholders No. of range Percentage of holding shareholders holding Up to 500 2,562 61.99% 2685 62.14% 501-5,000 1,554 37.60% 1619 37.47% 5,001-10,000 2 0.05% 2 0.05% 10,001-20,000 1 0.02% 0.02% 20,001-30,000 0.02% 1 0.02% 30,001-40,000 0.10% 0.09% 40,001-50,000 0.00% 0 0.00% 50,001-100,000 2 0.05% 0 0.00% 100,001-800,000 5 0.12% 7 0.16% Above 800,000 0.05% 2 0.05% 4,133 100% 4321 100% 1 1 4 4 2 30.06.2020 Taka 30.06.2019 Taka 11. 12. Share Premium 40,000,000 40,000,000 This represents share premium received in 1997 against right issue of 400,000 shares of Tk. 100 each. Face value of all shares has been converted from Tk. 100 each to Tk. 10 each. The share premium money shall be utilised for the purposes mentioned in the Companies Act, 1994 and Securities and Exchange Ordinance, 1969. Revaluation surplus Opening Balance 14,865,209 14,932, 150 Less: Transferred to depreciation of revalued asset 76,901 89,255 14,788,308 14,842,895 Less: Adjustment of deferred tax on revaluation surplus (19,225) (22,314) 14,807,533 14,865,209 Retained earnings Opening Balance 501,084,800 468,177,339 Add: Net profit after income tax for the year 45,578,886 58,418,206 Depreciation on revalued assets 76,901 89,255 546,740,587 526,684,800 Less: Cash dividend paid for the year 25,600,000 25,600,000 13. 521 140 587 501 084 800 2019-2020 Taka 2018-2019 Taka 23. Revenue Domestic sales net of VAT & SD (Note: 23.1) 1,539,419,792 1,939,571,613 Export sales (Note: 23.2) 1,101,847,839 882,258,780 2,641,267,631 2,821,830,393 23.1 Domestic sales net of VAT & SD Domestic sales including VAT & SD 1,875,092,857 2,266,790,388 Less: VAT 277,262,911 261,417,490 Supplementary duty (SD) 58,410,154 65,801,285 1,539,419,792 1,939,571,613 23.2 Export sales Export 893,282,051 741,269,622 Cash incentive 208,565,788 140,989,158 1,101,847,839 882, 3,780 During the year, export sales include Tk. 893,282,051 equivalent to US $ 105,90,774.09 (Tk. 741,269,622 equivalent to US $8,827,555.07 for the year ended 30 June 2019). 24. Cost of goods sold 2019-2020 Export Local 2018-2019 Taka Taka Opening stock of raw materials 196,627,796 344,672,619 541,300,415 519,564.737 Purchase during the year 756,138,045 1,085,072,815 1,841,210,860 1,987,673,128 Closing stock of raw materials(Note: 24.2) (178,317,951) (384,914,486) (563,232,437) (541,300,415) Materials consumed 774,447,890 1,044,830,948 1,819,278,838 1,965,937,450 Opening work in process 4,495,760 12,618,489 17,114,249 17,481,358 Factory overhead (Note: 24.1) 140,193,803 175,378,231 315,572,034 314,480,591 Closing work in process (Note: 24.3) (6,634,715) (9,269,531) (15,904,246) (17,114,249) Cost of goods manufactured 912,502,738 1,223,558,137 2,136,060,875 2,280,785,150 Opening stock of finished goods 7,317,142 20,537,412 27,854,554 27,397,024 Cost of goods available for sale 919,819,880 1,244,095,549 2,163,915,429 2,308,182,174 Closing stock of finished goodNote: 24.4) (6,987,726) (9,762,730) (16,750,456) (27,854,554) 912,832,154 1,234,332,819 2,147,164,973 2,280,327,620 24.1 Factory overhead Salaries, Alowances & Wages 54,724,103 76,456,444 131,180,547 122, 103,928 Carriage, Loading & Unloading 6,430,609 8,984,369 15,414,978 14,555,593 Travel & Conveyance 953,042 1,331,519 2,284,561 2,967,201 Printing & Stationery 769,433 1,074,995 1,844,428 1,727,134 Repairs & Maintenance 999,276 1,396,114 2,395,390 2,231,904 Depreciation (Annexure - A) 30,071,927 21,524,140 51,596,067 63,835,756 Entertainment 391,818 547,419 939,237 892,078 Postage & Telephone 630,264 880,559 1,510,823 1,427,357 Power & Fuel 39,227,248 54,805,392 94,032,640 90,978,377 Testing Fees 216,911 303,052 519,963 460,959 Medical & Sanitation 301,303 420,957 722,260 691,707 Uniform & Gloves 56,573 79,040 135,613 160,600 hsurance Premium 961,329 1,343,098 2,304,427 1,863,003 Cold Storage & Other Charges 4,459,967 6,231,133 10,691,100 10,584,994 140,193,803 175,378,231 315,572,034 314,480,591 24.2 Item wise quantity and value of raw materials Particulars Unit 30 June 2020 30 June 2019 Quantity Amount in Taka Quantity Amount in Taka Fruits, Vegetables & 2,118,598 224,274,115 3,117,301 304,642,410 Consumable Stores, Spices, Unit 30,231 109,785 2,383 16,052 Oil & Salt, Chemical & Litre 592 53,284 9,445 415,179 Packing & Others Kg 1,827,233 193,430,313 1,437,748 140,505,847 Additives Unit 38,914,020 141,318,922 14,202,927 95,672,881 Litre 44,982 4,046,018 1,093 48,046 563.232.437 541,300,415 kg 2019-2020 Taka 2018-2019 Taka 32. Earning Per Share Net Profit attributable to the ordinary shareholders (Tk.) Weighted average number of shares Basic Earning Per Share (EPS) 45,578,886 8,000,000 5.70 58,418,206 8,000,000 7.30 The Sales has been declined by Tk. 180,562,762 due to pandemic effect from Covid-19. The most impact was in sales for the 4th quarter. h addition to that, extra provision of the prior years' (Assessment year 2018-19 & 2019- 20) income tax U/S 82BB of Income Tax Ordinance 1984 amounting to Tk. 101,75,510 those have been charged during this year. 33. Net operating cash flow per share (NOCFPS) Net cash flow from operating activities 124,179,811 281,011,668 Weighted average number of shares 8,000,000 8,000,000 Net Operating Cash Flow Per Share (NOCFPS) 15.52 35.13 Net cash flow from operating activities has been reduced by Tk. 162,509,574 due to decrease in sales and increase in payment of previous years income tax payable during the year. 34. Net Asset Value (NAV) Per Share Net Asset Value (NAV) with revaluation surplus (A) 655,948,120 635,950,009 Revaluation surplus (14,807,533) (14,865,209) Net Asset Value (NAV) without revaluation surplus (B) 641,140,587 621,084,800 Number of ordinary shares outstanding (C) 8,000,000 8,000,000 Net Asset Value (NAV) Per Share with revaluation surplus (A+C) 81.99 79.49 Net Asset Value (NAV) Per Share without revaluation surplus (B+C) 80.14 77.64 Net Assets Value has been increased by Tk. 32,026,177 due to increase in total assets value by Tk. 18,631,817 and decrease in total liabilities by Tk. 13,394,360 with a good management of the Company. 35. Reconciliation of cash flows from operating activities Net Profit Before Tax 68,828,522 77,567,955 Adjustments for: Depreciation 53,365,763 66,033,122 Effect of exchange rate fluctuations on un-realised gain (119,872) (725,122) Repayment of lease liability 1,386,439 Payment of interest 126,742,088 150,477,201 Payment/(Adjustment) of Income Tax (46,354,981) (34,911,028) Changes in Working Capital: Inventories (9,617,921) (21,826,099) Accounts receivable (22,554,673) 16,222,429 Advance, deposit & prepayments (54,150,159) 8,328, 106 Accounts payable 1,194,030 787,208 Provision for expenses 5,411,728 19,334,002 Workers' profit participation fund (WPPF) & WF payable 48,847 (276,106) Net cash flow from operating activities 124,179,811 281,011,668 30.06.2020 Taka 14. Deferred tax liability Taxable temporary difference 21,490,090 30,024,354 14,836,383 554,987 2,963,287 4,140,083 (2.977,569) (4,160,037) 66,871,578 12,50% 25% 3% 25% Carrying amount Tax base Export Property, plant and equipment excluding land & land development 98,837,226 77,347,136 Local Property plant and equipment 138,088,015 108,063,661 excluding land & land development Revaluation Revaluation reserve for land and land 14,836,383 development Revaluation reserve for assets other than land and land development 554,987 Right of use assets Export 2,963,287 Local 4,140,083 Lease obligation Export (2,977,569) Local (4,160,037) Applicable Rate: Export Local Revaluation reserve for land and and development Revaluation reserve for other assets Deferred Tax Liability as at 30 June 2020- Export Deferred Tax Liability as at 30 June 2020- Local Deferred Tax Liability as at 30 June 2020-Revaluation reserve for land Deferred Tax Liability as at 30 June 2020- Revaluation resene for other assets Deferred Tax Liability as at 30 June 2020-ROU (Export) Deferred Tax Liability as at 30 June 2020- ROU (Local) Deferred Tax Assets as at 30 June 2020- Lease obligation (Export) Deferred Tax Assets as at 30 June 2020-Lease obligation (Local) Export Deferred Tax Liability as at 30 June 2020 Deferred Tax Liability as at 30 June 2019 Deferred Tax Expense for the year ended 30 June 2020 (a) Local Deferred Tax Liability as at 30 June 2020 Deferred Tax Liability as at 30 June 2019 Deferred Tax Income for the year ended 30 June 2020 (b) Total Deferred Tax Income (a+b) Revaluation reserve for Land and land development Deferred Tax Liability as at 30 June 2020 Deferred Tax Liability as at 30 June 2019 Deferred Tax expense for the year ended 30 June 2020 (a) Revaluation reserve for other assets Deferred Tax Liability as at 30 June 2020 Deferred Tax Liability as at 30 June 2019 Deferred Tax income for the year ended 30 June 2020 (b) Total Deferred tax income (a+b) AMCL has applied IFRS 16: "Leases" for the first time with the date of initial application of 1 July 2019. 2,686,261 7,506,089 445,091 138,747 370,411 1,035,021 (372,196) (1,040,009) 10,769,414 2,684,476 2,307.712 376,763 7,501, 101 10,146,622 (2,645,522) (2,268,758) 445,091 445,091 138,747 157.972 (19,225) (19,225) 30.06.2019 Taka Carrying amount Tax base Taxable temporary difference 90,670,546 72,208,848 18,461,698 199,331,557 158,745,069 40,586,488 Export Property, plant and equipment excluding land & land development Local Property, plant and equipment excluding land & land development Revaluation Revaluation reserve for land and land development Revaluation reserve for assets other than land and land development 14,836,383 14,836,383 631,888 631,8881 74,516,457 12.50% 25% 3% 25% Applicable Rate: Export Local Revaluation reserve for land & land development Revaluation reserve for other assets Deferred Tax Liability as at 30 June 2019- Export Deferred Tax Liability as at 30 June 2019- Local Deferred Tax Liability as at 30 June 2019-Revaluation reserve for land & land development Deferred Tax Liability as at 30 June 2019- Revaluation reserve for other assets 2,307,712 10,146,622 445,091 157,972 13,057,398 2,307,712 4,274,811 (1,967,098) 10,146,622 8,422,406 1,724,216 (242,882) Export Deferred Tax Liability as at 30 June 2019 Deferred Tax Liability as at 30 June 2018 Deferred Tax Income for the year ended 30 June 2019 (a) Local Deferred Tax Liability as at 30 June 2019 Deferred Tax Liability as at 30 June 2018 Deferred Tax income for the year ended 30 June 2019 (b) Total de ferred tax income (a+b) Revaluation reserve for land & land development Deferred Tax Liability as at 30 June 2019 Deferred Tax Liability as at 30 June 2018 Deferred Tax expense for the year ended 30 June 2019 (a) Revaluation reserve for other assets Deferred Tax Liability as at 30 June 2019 Deferred Tax Liability as at 30 June 2018 Deferred Tax income for the year 2019 (b) Total Deferred Tax income (a+b) 445,091 445,091 157,972 180,286 (22,314) (22,314) de 30 Agricultural Marketing Company Limited Schedule of Property, Plant and Equipment As at 30 June 2020 Cost Depreciation Balance as at 01 Addition during Balance as at 30 Balance as at 01 Rate (9 Charged during July 2019 the year June 2020 July 2019 the year Category of assets Balance as at 30 June 2020 Written Don Value as at June 2020 a. Freehold Assets Land & Land Development Factory Building Machinery & Equipment Furniture & Fixtures Tools & Accessories Vehicles Office Equipment Plastic Container Other Fixed Assets Sub Total b. Revalued Assets Land & Land Development Factory Building Machinery & Equipment Vehicles Sub Total Total as at 30 June 2020 20,887,705 154,104,021 836,246,218 2,391,217 272,417 71,042,060 2,531,438 10,392,058 22,217,888 1,120,085,022 20,887,705 154,104,021 836,246,218 2,391,217 272,417 71,042,060 2,743,438 10,392,058 22,217,888 1,120,297,022 10% 20% 15% 20% 20% 15% 20% 20% 107,127,309 602,674,095 2,204,362 270,471 62,563,380 2,281,524 10,087,010 21,987,063 809,195,214 4,697,671 46,714,426 28,028 389 1,695,736 45,437 61,010 46,165 53,288,862 111,824,980 649,388,521 2,232,390 270,860 64,259,1161 2,326,961 1 10,148,0201 22,033,228 862,484,076 20,887,7 42,279,0 186,857,6 158,8 1,5 6,782,9 416,4 244,0 184,6 257,812,9 212,000 212,000 14,836,383 5,024, 125 6,127,838 335,533 26,323,879 1,146,408,901 14,836,383 5,024, 125 6,127,838 335,533 26,323,879 1,146,620,901 10% 20% 20% 4,529,364 5,993,187 333,057 10,855,608 820,050,821 49,476 26,930 495 76,901 53,365,763 4,578,840 6,020,117 333,552 10,932,509 873,416,584 14,836,3 445,2 107,7 1.9 15,391,3 273,204,3 212,000 Total as at 30 June 2019 1,146,408,901 1,146,408,901 754,017,699 66,033,122 820,050,821 326,358,0 Right of use assets Right of use asset as at 30 June 2020 Allocation of depreciation: 8,524,044 8,524,044 1,420,674 1,420,674 7,103,3 Freehold Assets Cost of Goods Sold Administrative Expenses Seling and distribution Expenses Subtotal Right of use Assets Administrative Expenses Seling and distribution Expenses Subtotal Amount in Taka 30 June 2020 30 June 2019 51,596,067 63,835,756 707,878 878,946 1,061,818 1,318,420 53,365,763 66,033,122 355,169 1,065,506 1,420,674 Grand Total 54,786,437 66,033,122 MS. Golam Mostafa & Associates revalued the land, factory building, machinery & equipment and vehicles of the Company as at 10 December 1996. Agricultural Marketing Company L Reconciliation of effective tax rate For the year ended 30 June 2020 As per the Paragraph 81(c) of IAS 12 "Income Taxes", reconciliation of effective tax rate is: Rate % 2019-20 Local % % Taka Export 26,886,056 3,360,757 41,942,467 10,485,617 20.12% 25% 68,828,523 13,846,374 12.50% 12 Profit before tax Applicable tax Provision for Bad & Doubtful debts Depreciation as per Accounts Depreciation as per IT Schedule Effective current tax Proior year adjustment Adjustment for minimum tax Effective deferred tax 10.35% -8.88% 13.97% 1 -1 2,782,385.1 18.54% 7,774,682.75 15.34% (2,387,970) -15.91% (6,672,588) -13.16% 3,755,172 27.63% 11,587,712 22.29% 14.78% 0.00% -3.30% 33.78% 10,557,068 (9,060,558 15,342,884 10,175,510 1 (2,268,758) 23,249,636 Agricultural Marketing Company Limited Break-up of the Statement of Profit or Loss and Other Comprehensive I For the year ended 30 June 2020 Notes Export Domestic Revenue Less: Cost of goods sold Gross Profit 23 24 1,101,847,839 912,832,154 189,015,685 1,539,419,792 1,234,332,819 305,086,973 Less: Operating Expenses Administrative expenses Marketing expenses Selling expenses Distribution expenses Gross Operating Profit for the year Less: Finance expense Net Operating Profit for the year 25 26 27 28 107,534,855 31,612,820 15,447,721 19,681,913 40,792,401 81,480,830 55,645,816 25,835,014 188,613,942 34,156,418 77,784,625 25,100,978 51,571,922 116,473,031 74,148,502 42,324,529 29 Add: Non Operating Income Other income 30 Profit before contribution to Workers' Profit Participation Fund Less: Provision for contribution to WPPF Profit before income tax Less: Income tax expense Current tax 31 Deferred tax 14 Net profit after income tax Other comprehensive income Total comprehensive income 2,395,345 28,230,359 1,344,303 26,886,056 8,376,815 8,000,052 376,763 18,509,241 1,715,061 44,039,590 2,097,123 41,942,467 14,872,820 17,518,342 (2,645,522) 27,069,647 18,509,241 27,069,647 Earning per share (EPS) 32 2.31 3.38 Schedule of Property, Plant and Equipment As at 30 June 2020 Cost Depreciation Category of assets Balance as at 01 July 2019 Addition during the year Balance as at 30 Rate ( June 2020 Charged durin Balance as at 01 July 2019 the year a. Freehold Assets Land & Land Development Factory Building Machinery & Equipment Furniture & Fixtures Tools & Accessories Vehicles Office Equipment Plastic Container Other Fixed Assets Sub Total 20,887,705 154,104,021 836,246,218 2,391,217 272,417 71,042,060 2,531,438 10,392,058 22,217,888 1,120,085,022 20,887,705 154,104,021 836,246,218 2,391,217 272,417 71,042,060 2,743,438 10,392,058 22,217,888 1,120,297,022 10% 20% 15% 20% 20% 15% 20% 20% 107,127,309 602,674,095 2,204,362 270,471 62,563,380 2,281,524 10,087,010 21,987,063 809,195,214 4,697,6 46,714,4 28,02 3E 1,695,7 45,4 61,0 46,1 53,288,8 212,000 212,000 b. Revalued Assets Land & Land Development Factory Building Machinery & Equipment Vehicles Sub Total Total as at 30 June 2020 14,836,383 5,024,125 6,127,838 335,533 26,323,879 1,146,408,901 14,836,383 5,024, 125 6,127,838 335,533 26,323,879 1,146,620,901 10% 20% 20% 4,529,364 5,993, 187 333,057 10,855,608 820,050,821 49,4 26,9 4 76,9 53,365,7 212,000 Total as at 30 June 2019 1,146,408,901 1,146,408,901 754,017,699 66,033,1 Right of use assets Right of use asset as at 30 June 2020 Allocation of depreciation: 8,524,044 8,524,044 1,420,6 Freehold Assets Cost of Goods Sold Administrative Expenses Selling and distribution Expenses Subtotal Right of use Assets Administrative Expenses Selling and distribution Expenses Subtotal Amount in Taka 30 June 2020 30 June 2019 51,596,067 63,835,756 707,878 878,946 1,061,818 1,318,420 53,365,763 66,033,122 355,169 1,065,506 1,420,674 Grand Total 54,786,437 66,033,122 MS. Golam Mostafa & Associates revalued the land, factory building, machinery & equipment and vehicles of the Company as at 10 Decembe
Step by Step Solution
There are 3 Steps involved in it
Step: 1

Get Instant Access to Expert-Tailored Solutions
See step-by-step solutions with expert insights and AI powered tools for academic success
Step: 2

Step: 3
Ace Your Homework with AI
Get the answers you need in no time with our AI-driven, step-by-step assistance
Get Started
Modeling And Designing Accounting Systems Using Access To Build A Database
Authors: Laura R. Ingraham, C. Janie Chang
1st Edition
0471450871, 978-0471450870