

Answered step by step
Verified Expert Solution
Question
1 Approved Answer
Think of any retailer that operates many stores throughout the country. The retailer is often seeking to open new stores and needs to evaluate the
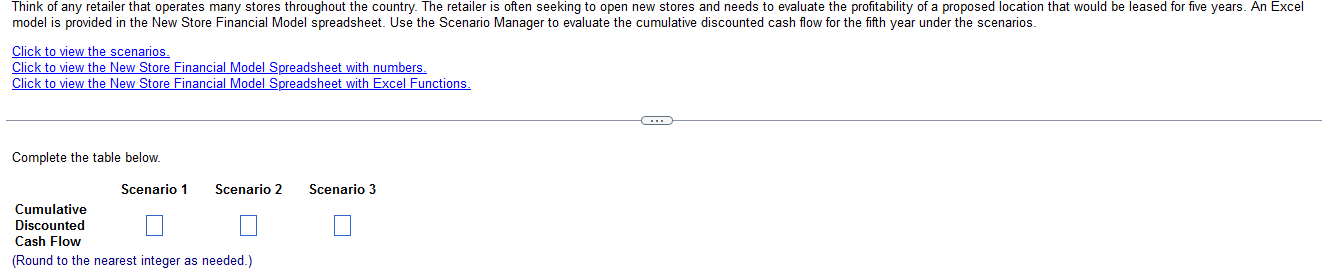
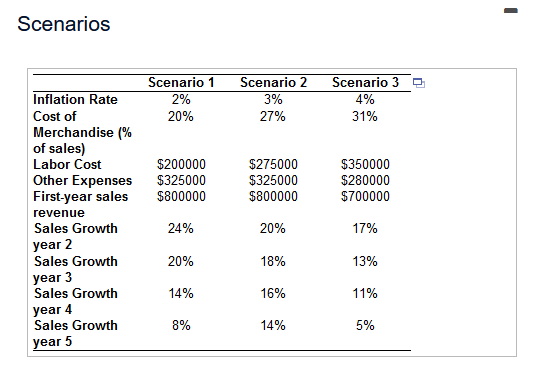
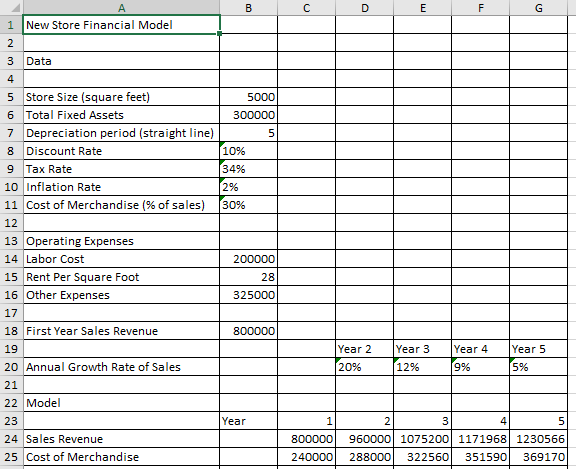
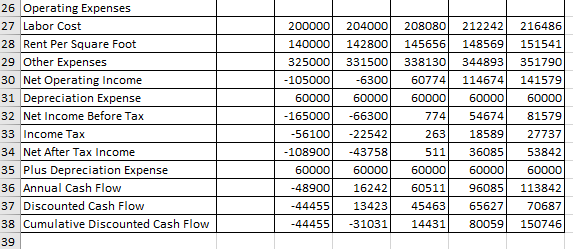
Think of any retailer that operates many stores throughout the country. The retailer is often seeking to open new stores and needs to evaluate the profitability of a proposed location that would be leased for five years. An Excel model is provided in the New Store Financial Model spreadsheet. Use the Scenario Manager to evaluate the cumulative discounted cash flow for the fifth year under the scenarios. Click to view the scenarios. Click to view the New Store Financial Model Spreadsheet with numbers. Click to view the New Store Financial Model Spreadsheet with Excel Functions. Complete the table below. Cumulative Discounted Scenario 1 Scenario 2 Scenario 3 Cash Flow (Round to the nearest integer as needed.) Scenarios Inflation Rate Cost of Merchandise (% of sales) Labor Cost Other Expenses First-year sales revenue Sales Growth year 2 Sales Growth year 3 Sales Growth year 4 Sales Growth year 5 Scenario 1 2% 20% $200000 $325000 $800000 24% 20% 14% 8% Scenario 2 3% 27% $275000 $325000 $800000 20% 18% 16% 14% Scenario 3 4% 31% $350000 $280000 $700000 17% 13% 11% 5% D 1 N34567 New Store Financial Model Data Store Size (square feet) 6 Total Fixed Assets 7 8 Discount Rate 9 Tax Rate Depreciation period (straight line) 13 Operating Expenses 14 Labor Cost 15 Rent Per Square Foot 16 Other Expenses 17 18 First Year Sales Revenue 19 20 Annual Growth Rate of Sales 21 22 Model 23 24 Sales Revenue 25 Cost of Merchandise B 5000 300000 10% 34% 10 Inflation Rate 2% 11 Cost of Merchandise (% of sales) (30% 12 5 200000 28 325000 800000 Year D Year 2 20% 2 E Year 3 12% 3 F Year 4 9% 4 G 1 800000 960000 1075200 1171968 1230566 240000 288000 322560 351590 369170 Year 5 5% 5 26 Operating Expenses 27 Labor Cost 28 Rent Per Square Foot 29 Other Expenses 30 Net Operating Income 31 Depreciation Expense 32 Net Income Before Tax 33 Income Tax 34 Net After Tax Income 35 Plus Depreciation Expense 36 Annual Cash Flow 37 Discounted Cash Flow 38 Cumulative Discounted Cash Flow 39 216486 200000 204000 208080 212242 140000 142800 145656 148569 151541 325000 331500 338130 344893 351790 -105000 -6300 60774 114674 141579 60000 60000 60000 60000 60000 -165000 -66300 774 54674 81579 -56100 -22542 263 18589 27737 -108900 -43758 511 36085 53842 60000 60000 60000 60000 60000 -48900 16242 60511 96085 113842 -44455 13423 45463 65627 70687 -44455 -31031 14431 80059 150746 Think of any retailer that operates many stores throughout the country. The retailer is often seeking to open new stores and needs to evaluate the profitability of a proposed location that would be leased for five years. An Excel model is provided in the New Store Financial Model spreadsheet. Use the Scenario Manager to evaluate the cumulative discounted cash flow for the fifth year under the scenarios. Click to view the scenarios. Click to view the New Store Financial Model Spreadsheet with numbers. Click to view the New Store Financial Model Spreadsheet with Excel Functions. Complete the table below. Cumulative Discounted Scenario 1 Scenario 2 Scenario 3 Cash Flow (Round to the nearest integer as needed.) Scenarios Inflation Rate Cost of Merchandise (% of sales) Labor Cost Other Expenses First-year sales revenue Sales Growth year 2 Sales Growth year 3 Sales Growth year 4 Sales Growth year 5 Scenario 1 2% 20% $200000 $325000 $800000 24% 20% 14% 8% Scenario 2 3% 27% $275000 $325000 $800000 20% 18% 16% 14% Scenario 3 4% 31% $350000 $280000 $700000 17% 13% 11% 5% D 1 N34567 New Store Financial Model Data Store Size (square feet) 6 Total Fixed Assets 7 8 Discount Rate 9 Tax Rate Depreciation period (straight line) 13 Operating Expenses 14 Labor Cost 15 Rent Per Square Foot 16 Other Expenses 17 18 First Year Sales Revenue 19 20 Annual Growth Rate of Sales 21 22 Model 23 24 Sales Revenue 25 Cost of Merchandise B 5000 300000 10% 34% 10 Inflation Rate 2% 11 Cost of Merchandise (% of sales) (30% 12 5 200000 28 325000 800000 Year D Year 2 20% 2 E Year 3 12% 3 F Year 4 9% 4 G 1 800000 960000 1075200 1171968 1230566 240000 288000 322560 351590 369170 Year 5 5% 5 26 Operating Expenses 27 Labor Cost 28 Rent Per Square Foot 29 Other Expenses 30 Net Operating Income 31 Depreciation Expense 32 Net Income Before Tax 33 Income Tax 34 Net After Tax Income 35 Plus Depreciation Expense 36 Annual Cash Flow 37 Discounted Cash Flow 38 Cumulative Discounted Cash Flow 39 216486 200000 204000 208080 212242 140000 142800 145656 148569 151541 325000 331500 338130 344893 351790 -105000 -6300 60774 114674 141579 60000 60000 60000 60000 60000 -165000 -66300 774 54674 81579 -56100 -22542 263 18589 27737 -108900 -43758 511 36085 53842 60000 60000 60000 60000 60000 -48900 16242 60511 96085 113842 -44455 13423 45463 65627 70687 -44455 -31031 14431 80059 150746
Step by Step Solution
There are 3 Steps involved in it
Step: 1

Get Instant Access to Expert-Tailored Solutions
See step-by-step solutions with expert insights and AI powered tools for academic success
Step: 2

Step: 3
Ace Your Homework with AI
Get the answers you need in no time with our AI-driven, step-by-step assistance
Get Started
Applications In Energy Finance
Authors: Christos Floros, Ioannis Chatziantoniou
1st Edition
3030929566, 978-3030929565