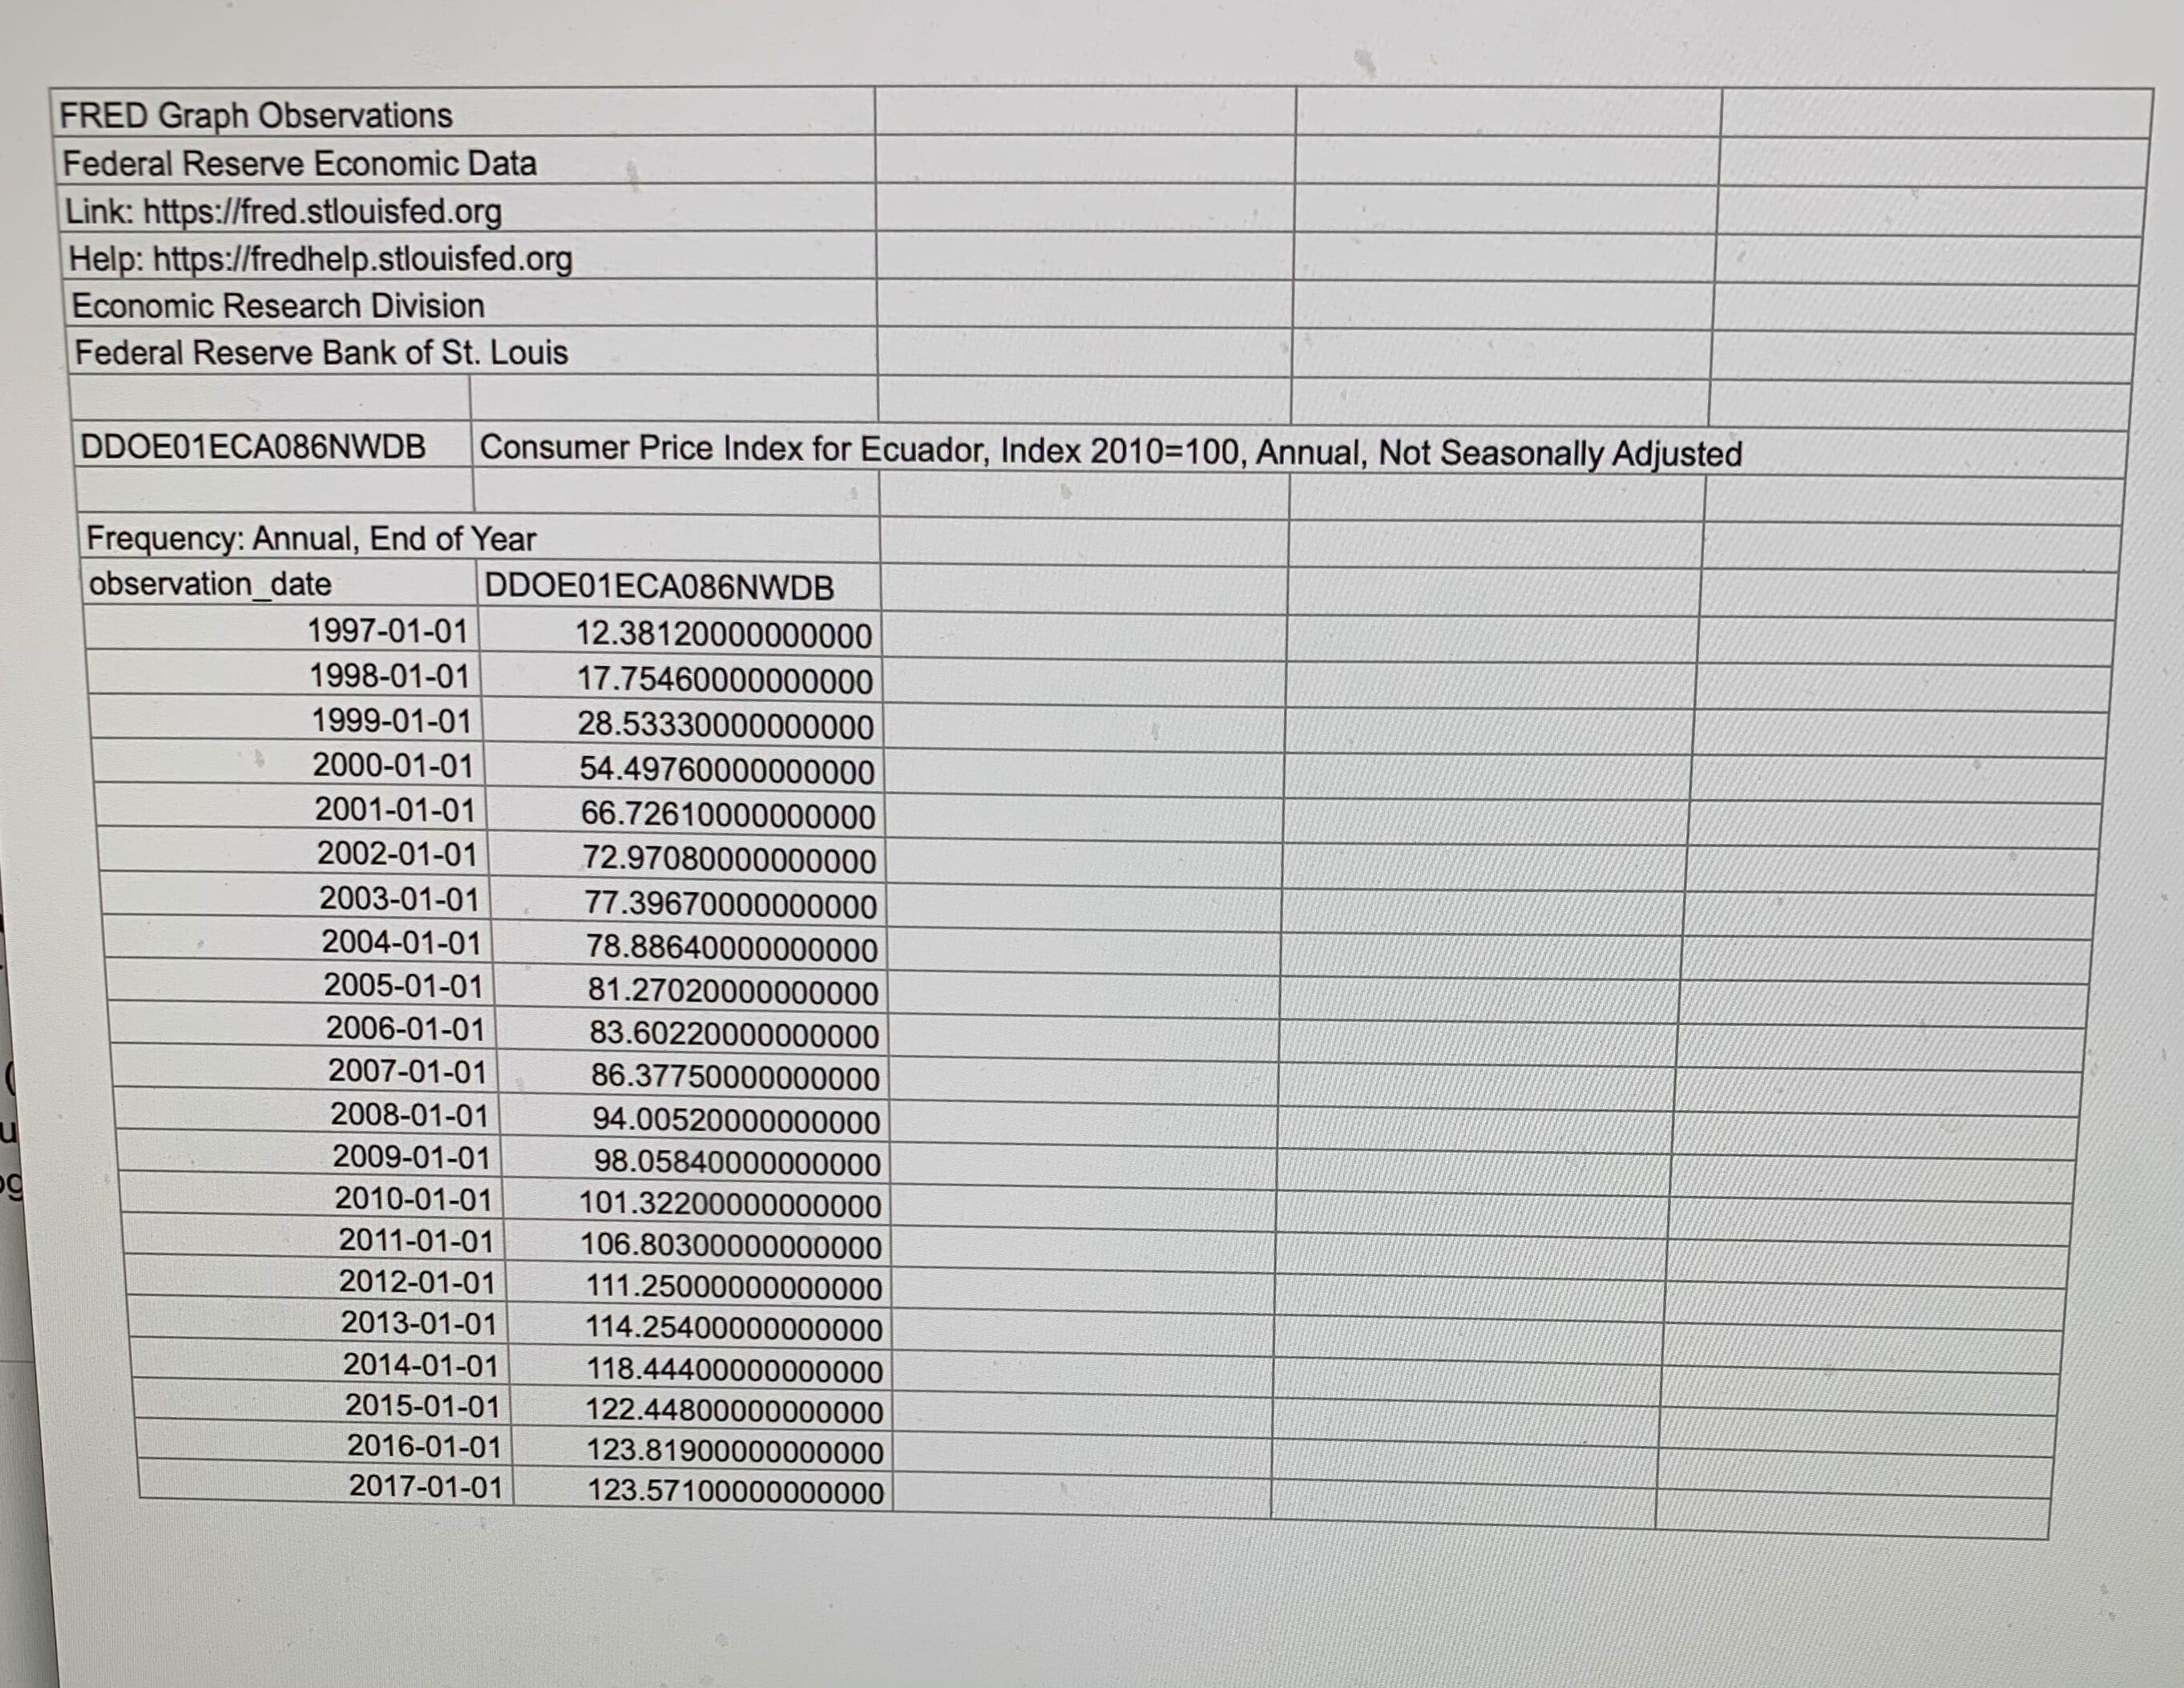
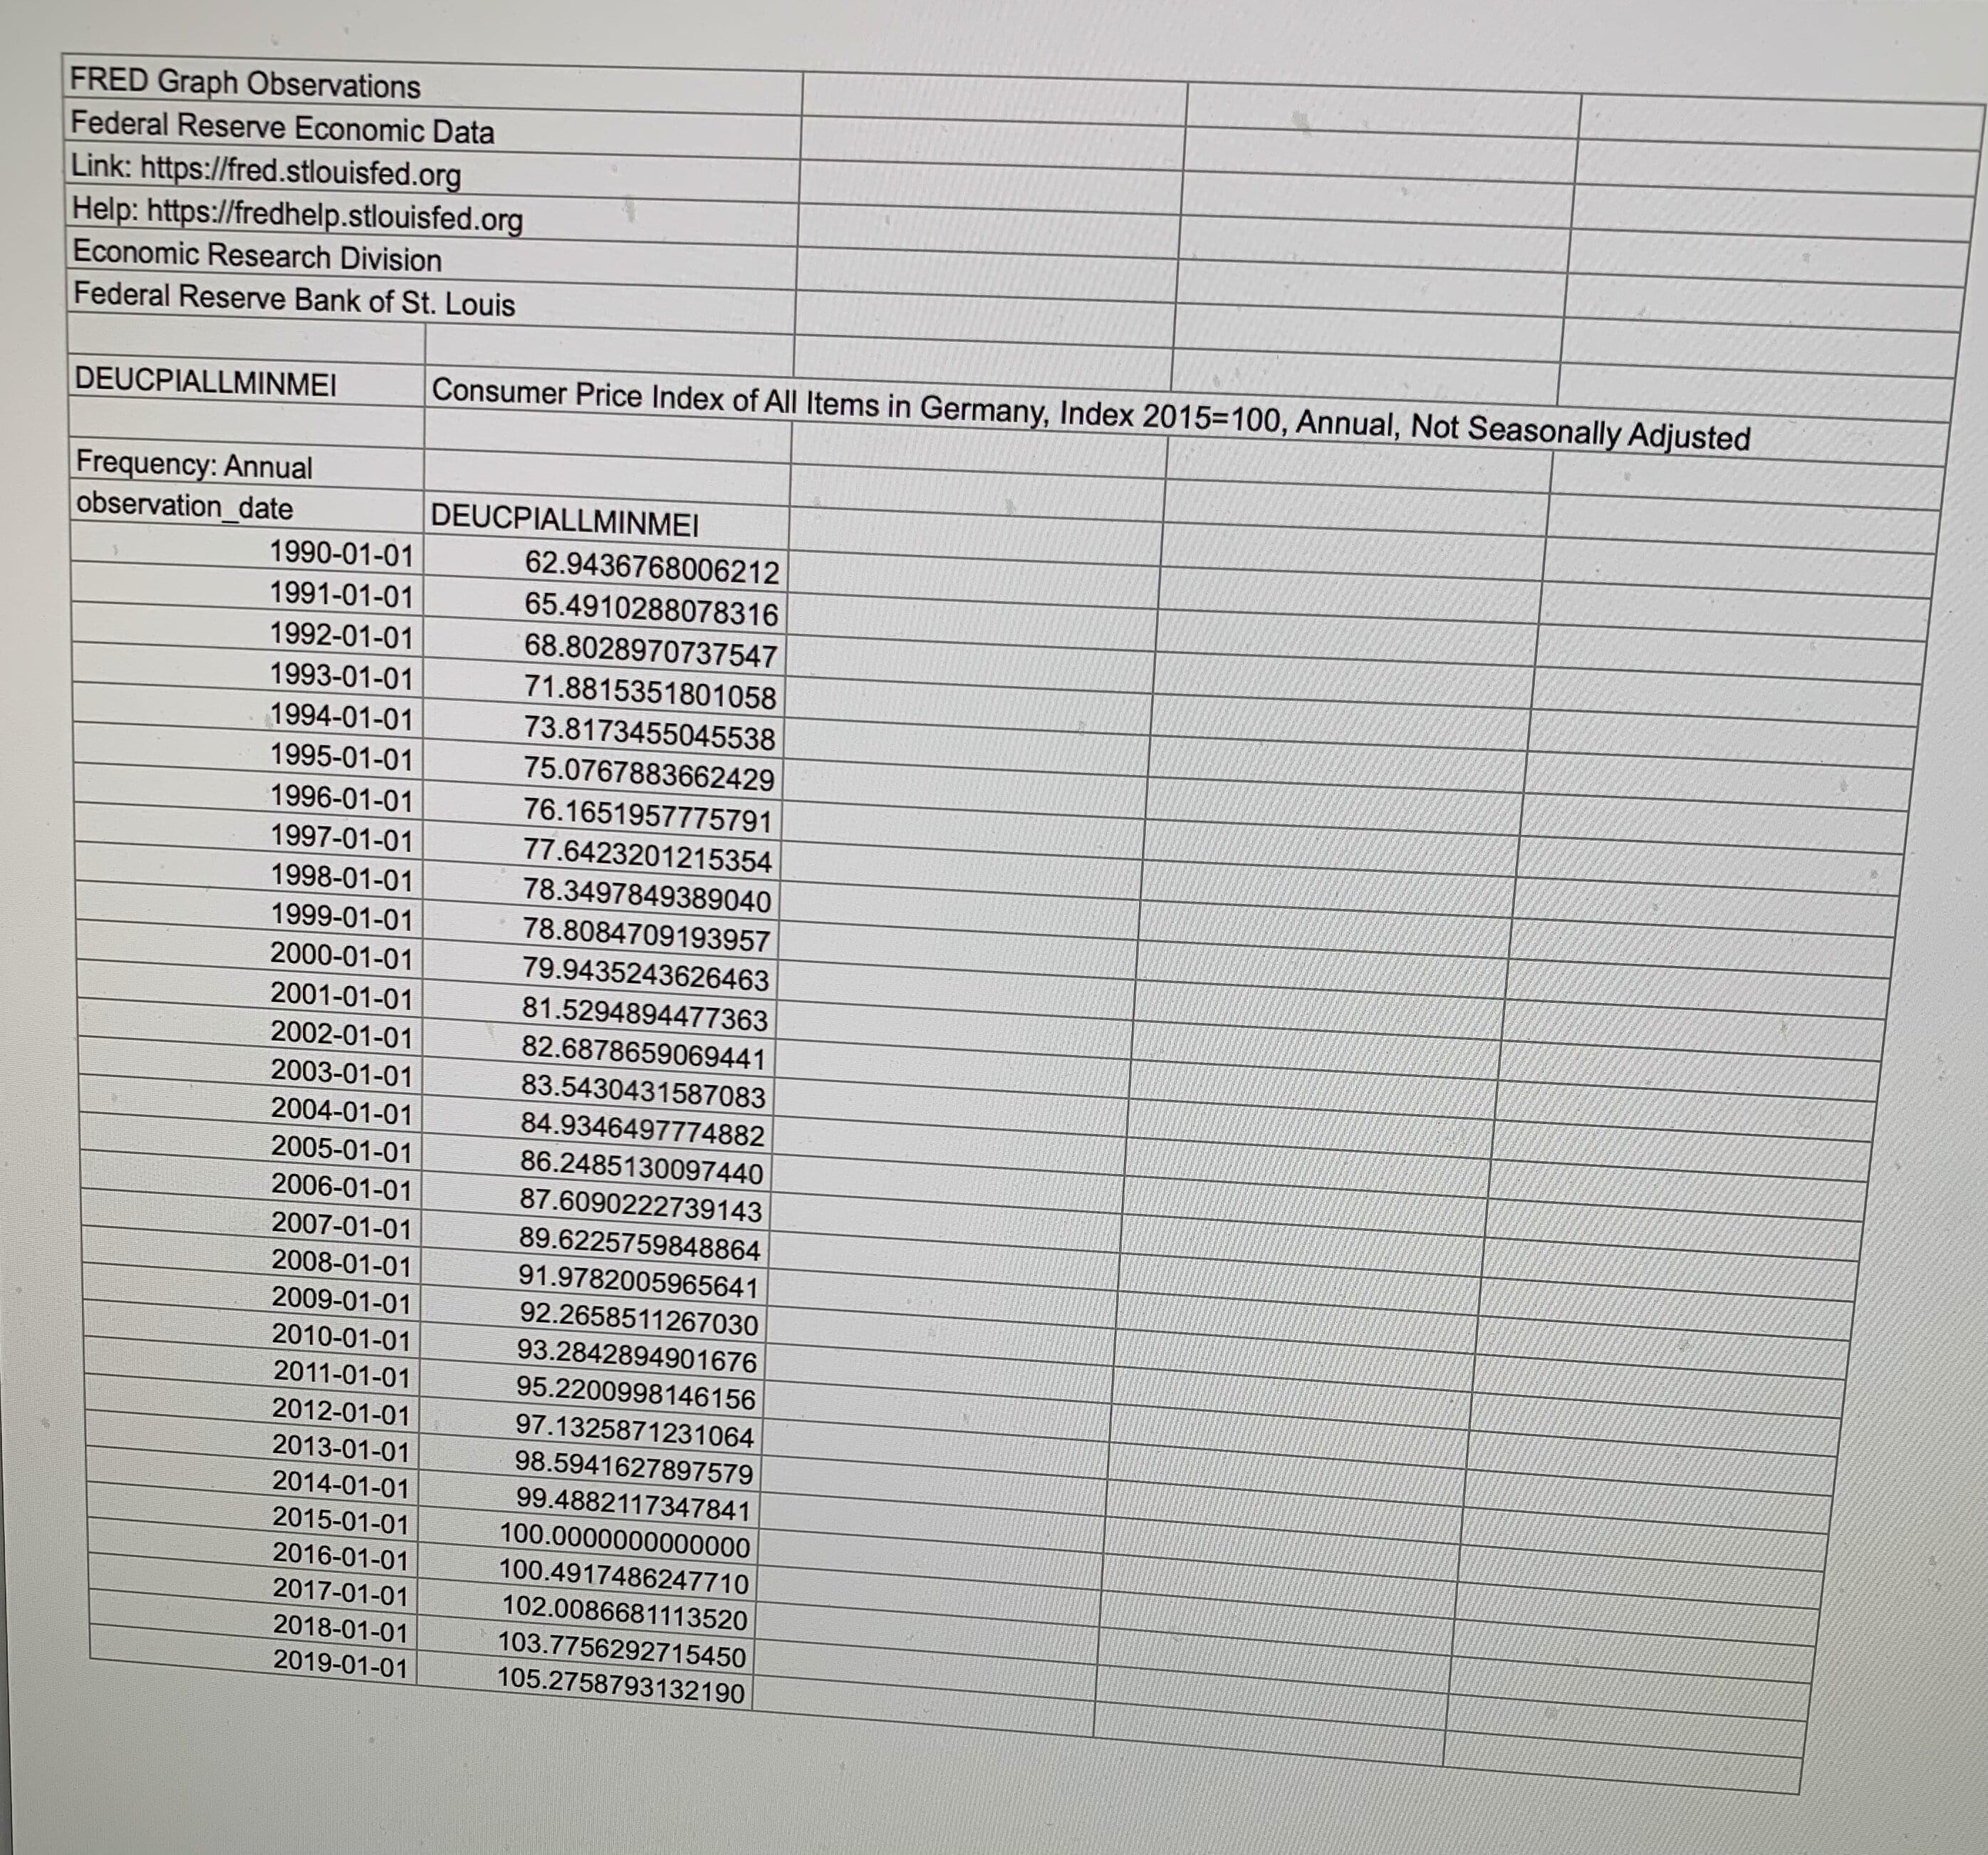
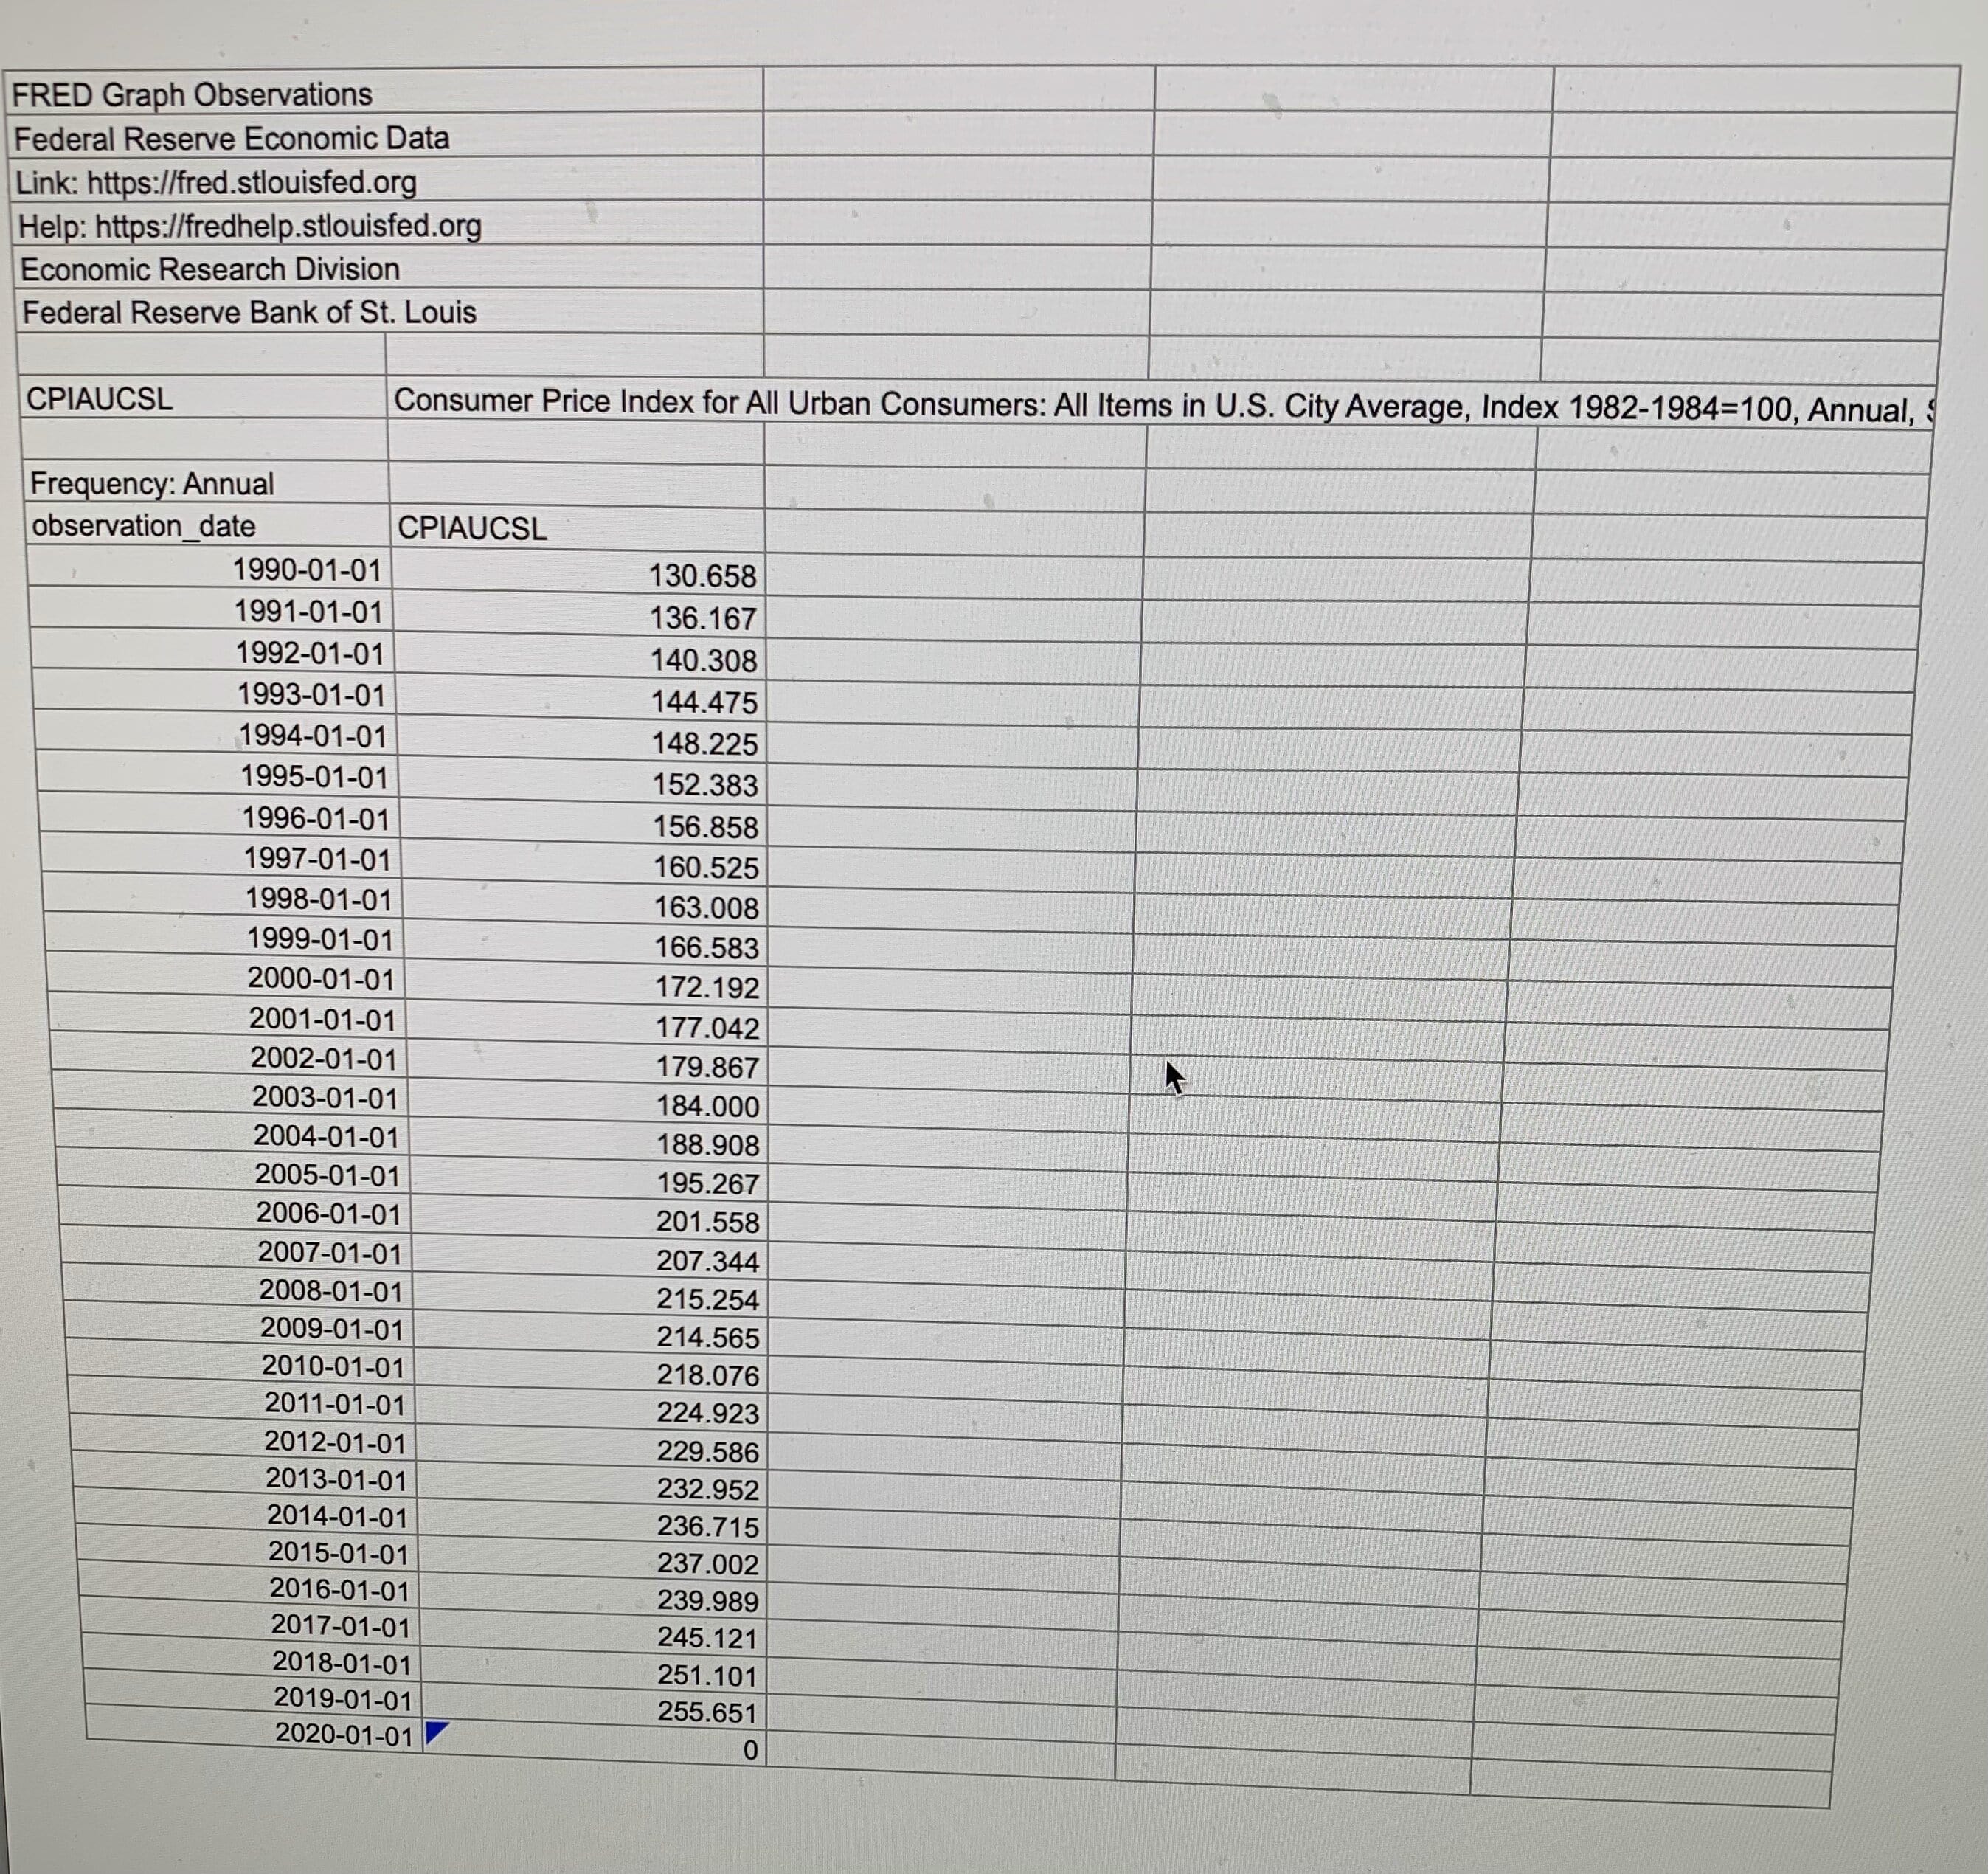
This assignment requires you to obtain data from the FRED Database. Find data for the Consumer Price Index (CPI) for the US, Germany and Ecuador from 1990 to 2019.
Download the data at an annual frequency (as opposed to monthly or quarterly). You will end up with 30 observations (one per year). Ecuador's data is only available from 1997 to 2017, but that's OK. Open the data into Excel or Google Sheets, or any other spreadsheet.
FRED Graph Observations Federal Reserve Economic Data Link: https://fred.stlouisfed.org Help: https://fredhelp.stlouisfed.org Economic Research Division Federal Reserve Bank of St. Louis DDOE01ECA086NWDB Consumer Price Index for Ecuador, Index 2010=100, Annual, Not Seasonally Adjusted Frequency: Annual, End of Year observation_date DDOE01ECA086NWDB 1997-01-01 12.38120000000000 1998-01-01 17.75460000000000 1999-01-01 28.53330000000000 2000-01-01 54.49760000000000 2001-01-01 66.72610000000000 2002-01-01 72.97080000000000 2003-01-01 77.39670000000000 2004-01-01 78.88640000000000 2005-01-01 81.27020000000000 2006-01-01 83.60220000000000 2007-01-01 86.37750000000000 2008-01-01 94.00520000000000 2009-01-01 98.05840000000000 2010-01-01 101.32200000000000 2011-01-01 106.80300000000000 2012-01-01 111.25000000000000 2013-01-01 114.25400000000000 2014-01-01 118.44400000000000 2015-01-01 122.44800000000000 2016-01-01 123.81900000000000 2017-01-01 123.57100000000000FRED Graph Observations Federal Reserve Economic Data Link: https://fred.stlouisfed.org Help: https://fredhelp.stlouisfed.org Economic Research Division Federal Reserve Bank of St. Louis DEUCPIALLMINMEI Consumer Price Index of All Items in Germany, Index 2015=100, Annual, Not Seasonally Adjusted Frequency: Annual observation_date DEUCPIALLMINMEI 1990-01-01 62.9436768006212 1991-01-01 65.4910288078316 1992-01-01 68.8028970737547 1993-01-01 71.8815351801058 1994-01-01 73.8173455045538 1995-01-01 75.0767883662429 1996-01-01 76.1651957775791 1997-01-01 77.6423201215354 1998-01-01 78.3497849389040 1999-01-01 78.8084709193957 2000-01-01 79.9435243626463 2001-01-01 81.5294894477363 2002-01-01 82.6878659069441 2003-01-01 83.5430431587083 2004-01-01 84.9346497774882 2005-01-01 86.2485130097440 2006-01-01 87.6090222739143 2007-01-01 89.6225759848864 2008-01-01 91.9782005965641 2009-01-01 92.2658511267030 2010-01-01 93.2842894901676 2011-01-01 95.2200998146156 2012-01-01 97.1325871231064 2013-01-01 98.5941627897579 2014-01-01 99.4882117347841 2015-01-01 100.0000000000000 2016-01-01 100.4917486247710 2017-01-01 102.0086681113520 2018-01-01 103.7756292715450 2019-01-01 105.2758793132190FRED Graph Observations Federal Reserve Economic Data Link: https://fred.stlouisfed.org Help: https://fredhelp.stlouisfed.org Economic Research Division Federal Reserve Bank of St. Louis CPIAUCSL Consumer Price Index for All Urban Consumers: All Items in U.S. City Average, Index 1982-1984=100, Annual, Frequency: Annual observation date PIAUCSL 1990-01-01 130.658 1991-01-01 136.167 1992-01-01 140.308 1993-01-01 144.475 1994-01-01 148.225 1995-01-01 152.383 1996-01-01 156.858 1997-01-01 160.525 1998-01-01 163.008 1999-01-01 166.583 2000-01-01 172.192 2001-01-01 177.042 2002-01-01 179.867 2003-01-01 184.000 2004-01-01 188.908 2005-01-01 195.267 2006-01-01 201.558 2007-01-01 207.344 2008-01-01 215.254 2009-01-01 214.565 2010-01-01 218.076 2011-01-01 224.923 2012-01-01 229.586 2013-01-01 232.952 2014-01-01 236.715 2015-01-01 237.002 2016-01-01 239.989 2017-01-0 245.121 2018-01-01 2019-01-01 251.101 2020-01-01 255.651 0


