This case examines the October 2015 initial public offering pricing decision for legendary Italian sports car company Ferrari by Fiat Chrysler (FCA) management. You will model the value of Ferrari in light of Ferrari Chairman Sergio Marchionne's interest in expanding production despite the company's long-standing tradition of a severely limited-production strategy to maintain an exclusive brand image. The case is designed to showcase corporate valuation using discounted cash flow (DCF) and peer-company market multiples for a company that exists in two sectors: automotive and luxury goods.
Structure the discussion around the following key questions:
- What are the financial implications of Ferrari's current strategy?
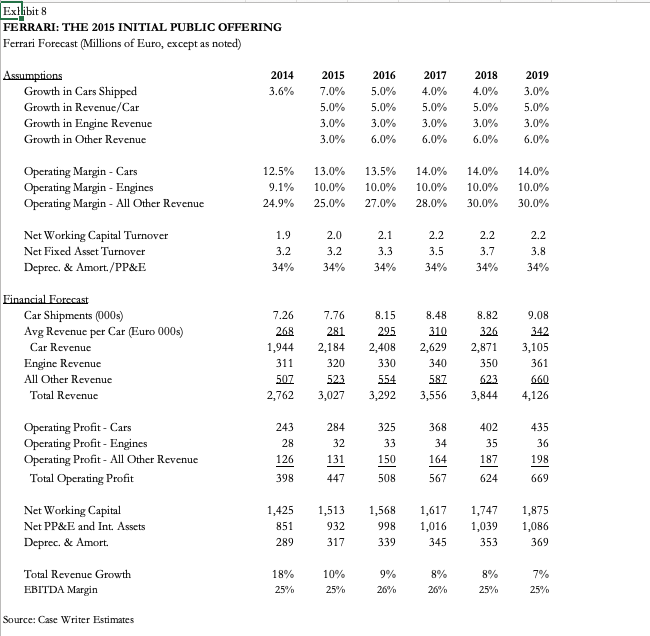
- Does this agree with the financial forecast in Exhibit8? If so, why? If not, what specific concerns may have?
- How muchdo Ferrari is worth in euros? Describe in detail how would the estimate Ferrari's value. For instance, would recommend using a current market-multiples valuation?A discounted cash flow (DCF) valuation?A different method?
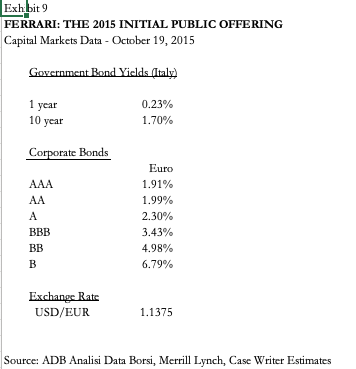
- In preparation for Ferrari's listing on the New York Stock Exchange, at what price in U.S. dollars would recommend that Ferrari shares be sold?
Please post directly to the discussion board; do not only upload an attachment.
This may include supplementary attachments if they help support or illustrate the position.
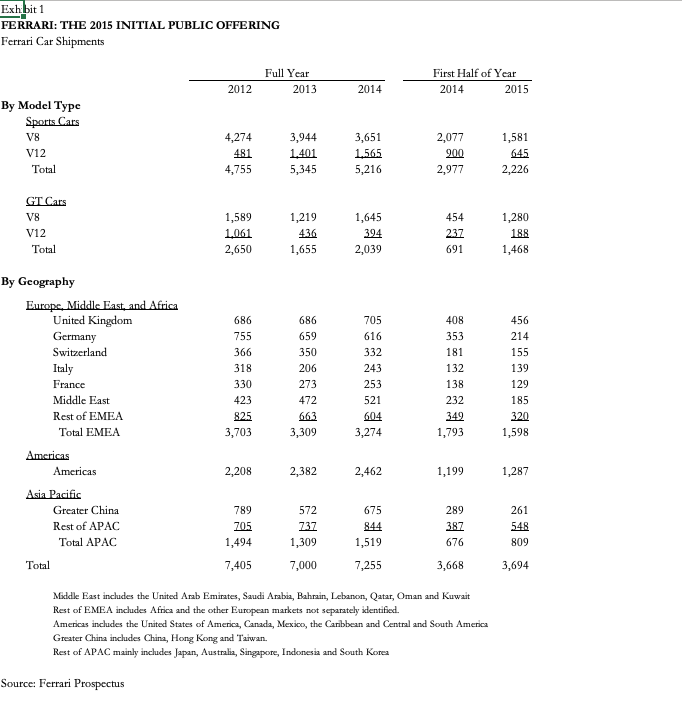
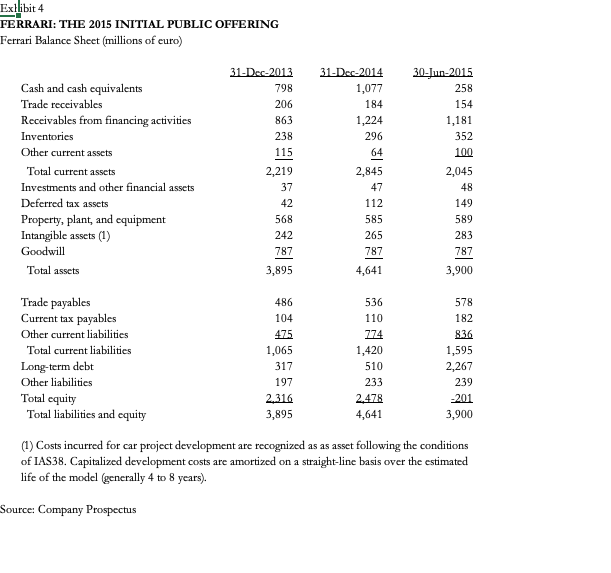
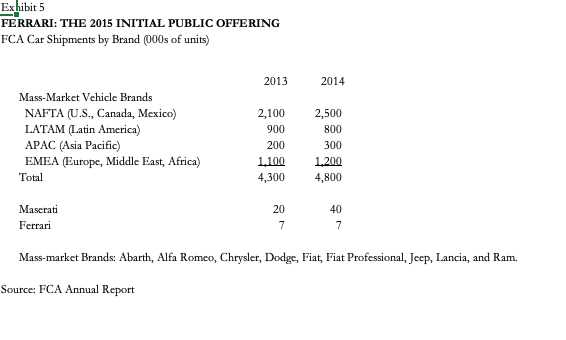
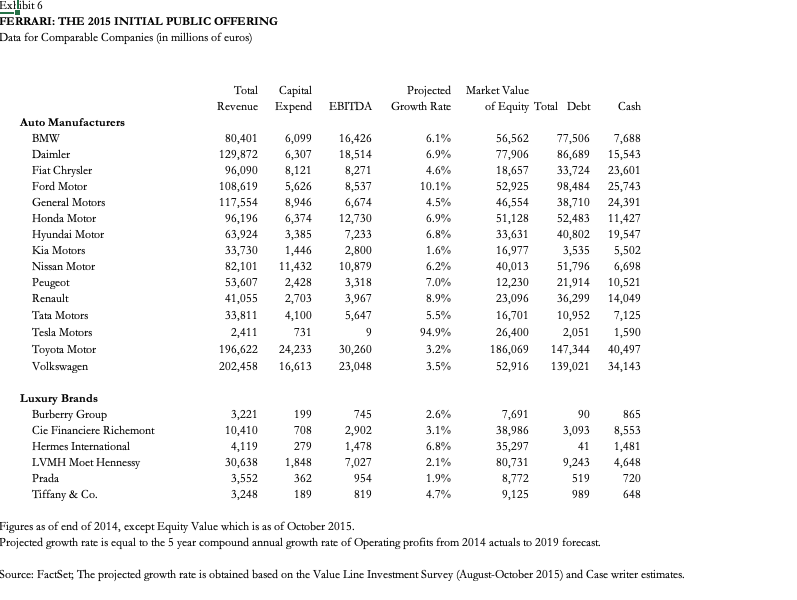
Exhibit 1 FERRARI: THE 2015 INITIAL PUBLIC OFFERING Ferrari Car Shipments Full Year First Half of Year 2012 2013 2014 2014 2015 By Model Type Sports Cars VB 4,274 3,944 3,651 2,077 1,581 V12 481 1,401 1,565 900 645 Total 4,755 5,345 5,216 2,977 2,226 GT Cars VB 1,589 1,219 1,645 454 1,280 V12 1.061 436 394 237 188 Total 2,650 1,655 2,039 691 1,468 By Geography Europe, Middle East, and Africa United Kingdom 686 686 705 408 456 Germany 755 659 616 353 214 Switzerland 366 350 332 181 155 Italy 318 206 243 132 139 France 330 273 253 138 129 Middle East 423 472 521 232 185 Rest of EMEA 825 663 604 349 320 Total EMEA 3,703 3,309 3,274 1,793 1,598 Americas Americas 2,208 2,382 2,462 1,199 1,287 Asia Pacific Greater China 789 572 675 289 261 Rest of APAC 705 737 844 387 548 Total APAC 1,494 1,309 1,519 676 809 Total 7,405 7,000 7,255 3,668 3,694 Middle East includes the United Arab Emirates, Saudi Arabia, Bahrain, Lebanon, Qatar, Oman and Kuwait Rest of EMEA includes Africa and the other European markets not separately identified Americas includes the United States of America, Canada, Mexico, the Caribbean and Central and South America Greater China includes China, Hong Kong and Taiwan. Rest of APAC mainly includes Japan, Australia, Singapore, Indonesia and South Korea Source: Ferrari ProspectusExllibit 4 FERRARI: THE 2015 INITIAL PUBLIC OFFERING Ferrari Balance Sheet (millions of euro) 31-Der-2013 31-Der-2014 30-Jun-2015 Cash and cash equivalents 798 1,077 258 Trade receivables 206 184 154 Receivables from financing activities 863 1,224 1,181 Inventories 238 296 352 Other current assets 115 64 100 Total current assets 2,219 2,845 2,045 Investments and other financial assets 37 47 48 Deferred tax assets 42 112 149 Property, plant, and equipment 568 585 589 Intangible assets (1) 242 265 283 Goodwill 787 787 787 Total assets 3,895 4,641 3,900 Trade payables 486 536 578 Current tax payables 104 110 182 Other current liabilities 475 774 836 Total current liabilities 1,065 1,420 1,595 Long-term debt 317 510 2,267 Other liabilities 197 233 239 Total equity 2.316 2.478 -201 Total liabilities and equity 3,895 4,641 3,900 (1) Costs incurred for car project development are recognized as as asset following the conditions of IAS38. Capitalized development costs are amortized on a straight-line basis over the estimated life of the model (generally 4 to 8 years). Source: Company ProspectusExhibit 5 FERRARI: THE 2015 INITIAL PUBLIC OFFERING FCA Car Shipments by Brand (000s of units) 2013 2014 Mass-Market Vehicle Brands NAFTA (U.S., Canada, Mexico) 2,100 2,500 LATAM (Latin America) 900 800 APAC (Asia Pacific) 200 300 EMEA (Europe, Middle East, Africa) 1.100 1.200 Total 4,300 4,800 Maserati 20 40 Ferrari 7 7 Mass-market Brands: Abarth, Alfa Romeo, Chrysler, Dodge, Fiat, Fiat Professional, Jeep, Lancia, and Ram. Source: FCA Annual ReportExllibit 6 FERRARI: THE 2015 INITIAL PUBLIC OFFERING Data for Comparable Companies (in millions of euros) Total Capital Projected Market Value Revenue Expend EBITDA Growth Rate of Equity Total Debt Cash Auto Manufacturers BMW 80,401 6,099 16,426 6.1% 56,562 77,506 7,688 Daimler 129,872 6,307 18,514 6.9% 77,906 86,689 15,543 Fiat Chrysler 96,090 8,121 8,271 4.6% 18,657 33,724 23,601 Ford Motor 108,619 5,626 8,537 10.1% 52,925 98,484 25,743 General Motors 117,554 8,946 6,674 4.5% 46,554 38,710 24,391 Honda Motor 96,196 6,374 12,730 6.9% 51,128 52,483 11,427 Hyundai Motor 63,924 3,385 7,233 6.8% 33,631 40,802 19,547 Kia Motors 33,730 1,446 2,800 1.6% 16,977 3,535 5,502 Nissan Motor 82,101 11,432 10,879 6.2% 40,013 51,796 6,698 Peugeot 53,607 2,428 3,318 7.0% 12,230 21,914 10,521 Renault 41,055 2,703 3,967 8.9% 23,096 36,299 14,049 Tata Motors 33,811 4,100 5,647 5.5% 16,701 10,952 7,125 Tesla Motors 2,411 731 9 94.9% 26,400 2,051 1,590 Toyota Motor 196,622 24,233 30,260 3.2% 186,069 147,344 40,497 Volkswagen 202,458 16,613 23,048 3.5% 52,916 139,021 34,143 Luxury Brands Burberry Group 3,221 199 745 2.6% 7,691 90 865 Cie Financiere Richemont 10,410 708 2,902 3.1% 38,986 3,093 8,553 Hermes International 4,119 279 1,478 6.8% 35,297 41 1,481 LVMH Moet Hennessy 30,638 1,848 7,027 2.1% 80,731 9,243 4,648 Prada 3,552 362 954 1.9% 8,772 519 720 Tiffany & Co. 3,248 189 819 4.7% 9,125 989 648 igures as of end of 2014, except Equity Value which is as of October 2015. Projected growth rate is equal to the 5 year compound annual growth rate of Operating profits from 2014 actuals to 2019 forecast. Source: FactSet; The projected growth rate is obtained based on the Value Line Investment Survey (August-October 2015) and Case writer estimates.Exllibit 8 FERRARI: THE 2015 INITIAL PUBLIC OFFERING Ferrari Forecast (Millions of Euro, except as noted) Assumptions 2014 2015 2016 2017 2018 2019 Growth in Cars Shipped 3.6% 7.0% 5.0% 4.0% 4.0% 3.0% Growth in Revenue/Car 5.0% 5.0% 5.0% 5.0% 5.0% Growth in Engine Revenue 3.0% 3.0% 3.0% 3.0% 3.0% Growth in Other Revenue 3.0% 6.0% 6.0% 6.0% 6.0% Operating Margin - Cars 12.5% 13.0% 13.5% 14.0% 14.0% 14.0% Operating Margin - Engines 9.1% 10.0% 10.0% 10.0% 10.0% 10.0% Operating Margin - All Other Revenue 24.9% 25.0% 27.0% 28.0% 30.0% 30.0% Net Working Capital Turnover 1.9 2.0 2.1 2.2 2.2 2.2 Net Fixed Asset Turnover 3.2 3.2 3.3 3.5 3.7 3.8 Deprec. & Amort./PP&E 34% 34% 34% 34% 34% 34% Financial Forecast Car Shipments (000s) 7.26 7.76 8.15 8.48 8.82 9.08 Avg Revenue per Car (Euro 000s) 268 281 295 310 126 342 Car Revenue 1,944 2,184 2,408 2,629 2,871 3,105 Engine Revenue 311 320 330 340 350 361 All Other Revenue 507 123 154 587 623 560 Total Revenue 2,762 3,027 3,292 3,556 3,844 4,126 Operating Profit - Cars 243 284 325 368 402 435 Operating Profit - Engines 28 32 33 34 35 36 Operating Profit - All Other Revenue 126 131 150 164 187 198 Total Operating Profit 398 447 508 567 624 669 Net Working Capital 1,425 1,513 1,568 1,617 1,747 1,875 Net PP&E and Int. Assets 851 932 998 1,016 1,039 1.086 Deprec. & Amort. 289 317 339 345 353 369 Total Revenue Growth 1 8% 10% 9% 8% 8% 7% EBITDA Margin 25% 25% 26% 26% 25% 25%% Source: Case Writer EstimatesExhibit 9 FERRARI: THE 2015 INITIAL PUBLIC OFFERING Capital Markets Data - October 19, 2015 Government Bond Yields (Italy) 1 year 0.23% 10 year 1.70% Corporate Bonds Euro AAA 1.91% AA 1.99% A 2.30% BBB 3.43% BB 4.98% B 6.79% Exchange Rate USD/EUR 1.1375 Source: ADB Analisi Data Borsi, Merrill Lynch, Case Writer Estimates