This case puts you in the driver seat (as a production planner). There is an xls workbook on your student DVD that you can access, and save to your PC, as a starting point - or simply download the attachment. Your job is to prepare production schedule (considering the constraints and rules of this case in Chp 19), and to determine the operating budget for such a plan. There are 3 worksheets available to execute this plan - the 1st Aggregate Plan is where you determine your production plan/schedule (by indicating the number of lines and overtime hrs per day), and the budget (costs) associated with your plan - these are the yellow highlighted sections of the worksheet - you need to determine how many production lines to run, how many hours of overtime to work per day, and the corresponding budgeted line items in the lower highlighted budget section - you can use the defaulted number of production lines and overtime hours as a first try; 2nd is the Simulation Worksheet where you need to indicate the Actual Production Rate and the Actual Demand columns cells (in reality the actual data would be getting filled in each week as time progresses, but you need to fill all 52 weeks with numbers (simply enter 450 into the Actual Production Rate column (each cell) and then copy the Forecast column into the Actual Demand column) - which will end up simulating how much your plan will actually cost onto the 3rd sheet; 3rd is the Actual Cost worksheet, which will fill in automatically, based on data from the Simulation Worksheet. The main idea here is to do your planning (sheet 1), estimate your budget (sheet 1), enter in the production rate and demand (sheet 2), which will automatically generate numbers showing the actual costs (sheet 3) - lastly, you should compare your budget (sheet 1) to what it actually costs to execute (sheet 3).
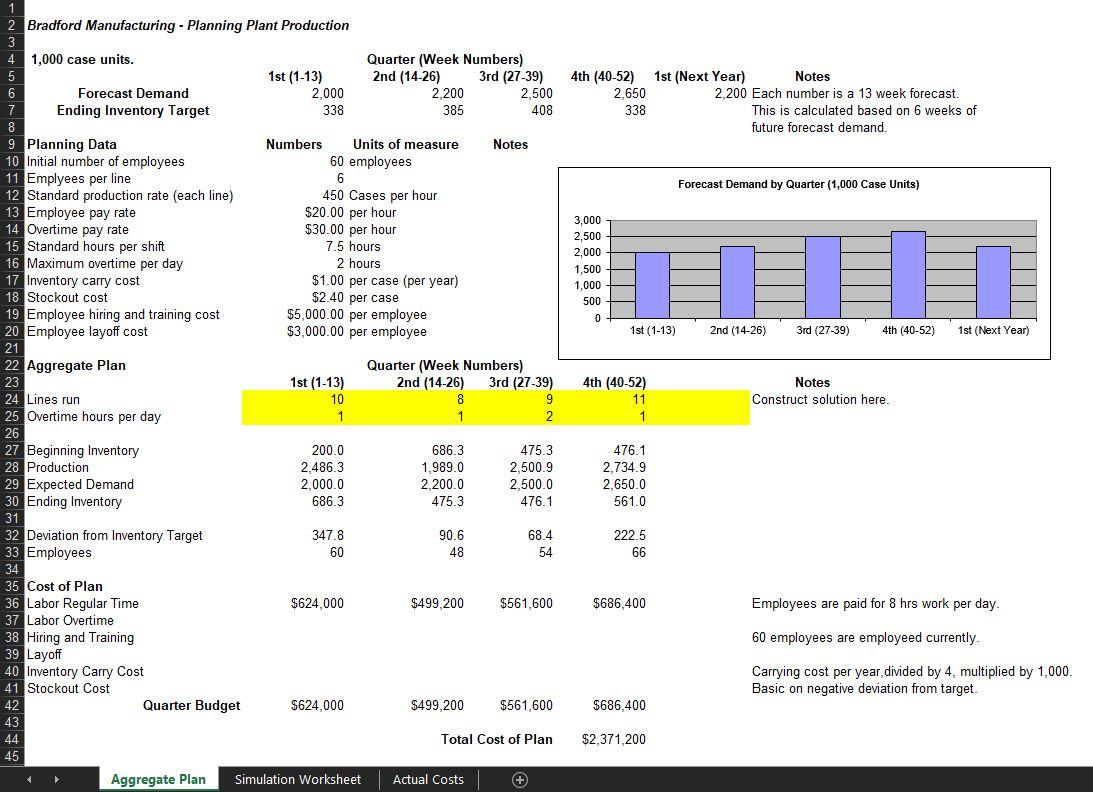
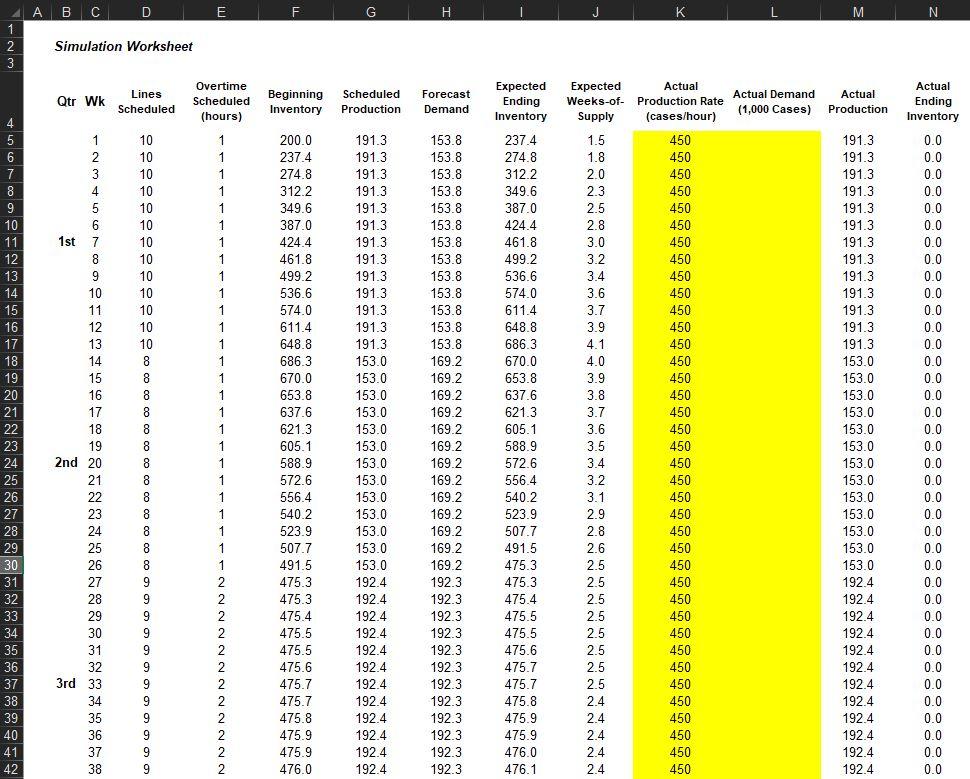
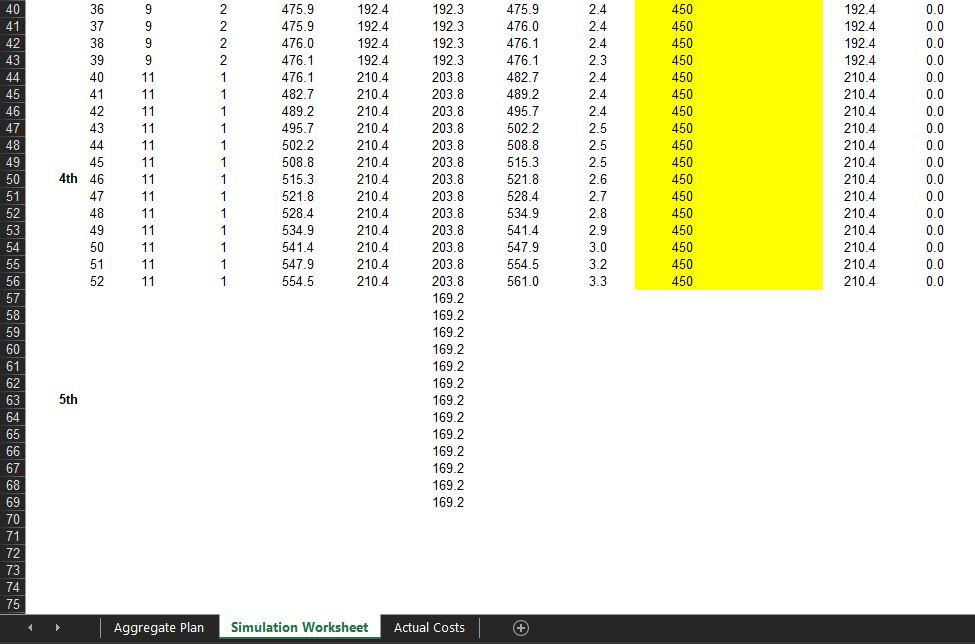
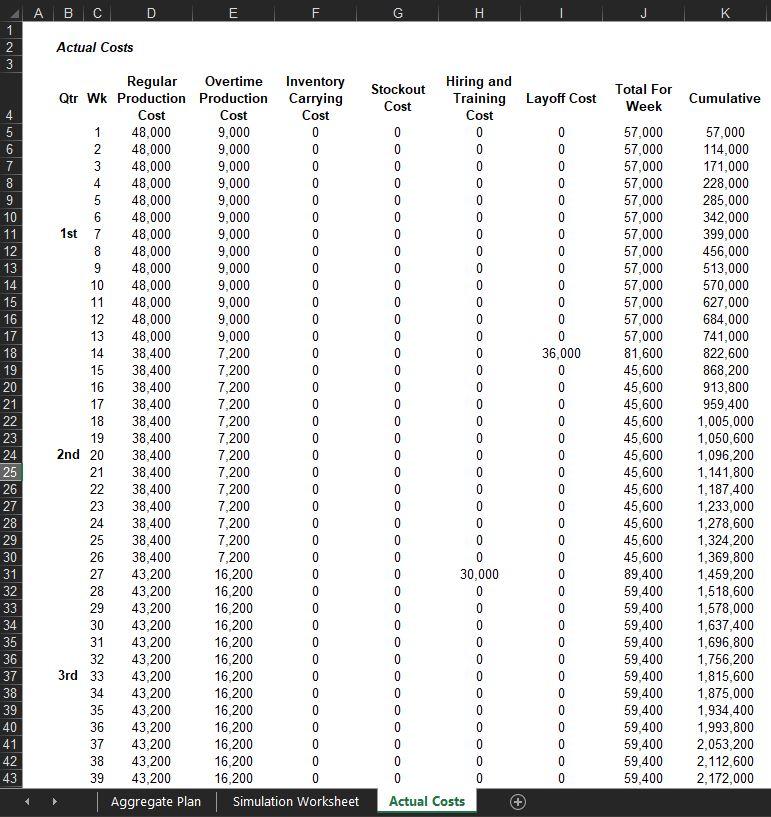
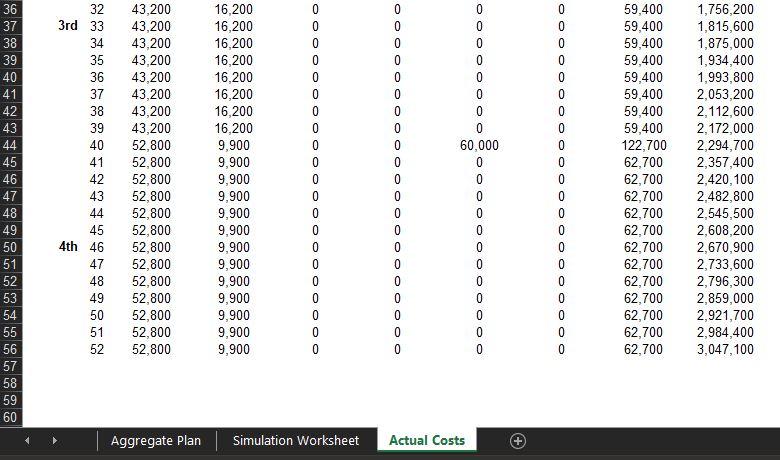
Bradford Manufacturing - Planning Plant Production 4 1,000 case units. Quarter (Week Numbers) 2nd (14-26) 3rd (27-39) 2,200 2,500 385 408 1st (1-13) 2,000 338 Forecast Demand Ending Inventory Target 4th (40-52) 2,650 338 1st (Next Year) Notes 2,200 Each number is a 13 week forecast. This is calculated based on 6 weeks of future forecast demand. Notes Forecast Demand by Quarter (1,000 Case Units) Numbers Units of measure 60 employees 6 450 Cases per hour $20.00 per hour $30.00 per hour 7.5 hours 2 hours $1.00 per case (per year) $2.40 per case $5,000.00 per employee $3,000.00 per employee 3,000 2,500 2,000 1,500 1,000 500 0 1st (1-13) 2nd (14-26) 3rd (27-39) 4th (40-52) 1st (Next Year) 9 Planning Data 10 Initial number of employees 11 Emplyees per line 12 Standard production rate (each line) 13 Employee pay rate 14 Overtime pay rate 15 Standard hours per shift 16 Maximum overtime per day 17 Inventory carry cost 18 Stockout cost 19 Employee hiring and training cost 20 Employee layoff cost 21 22 Aggregate Plan 23 24 Lines run 25 Overtime hours per day 26 27 Beginning Inventory 28 Production 29 Expected Demand 30 Ending Inventory 31 32 Deviation from Inventory Target 33 Employees 34 35 Cost of Plan 36 Labor Regular Time 37 Labor Overtime 38 Hiring and Training 1st (1-13) 10 1 Quarter (Week Numbers) 2nd (14-26) 3rd (27-39) 8 9 1 2 4th (40-52) 11 1 Notes Construct solution here 200.0 2.486.3 2.000.0 686.3 686.3 1,989.0 2,200.0 475.3 475.3 2,500.9 2,500.0 476.1 476.1 2,734.9 2,650.0 561.0 347.8 60 90.6 48 68.4 54 222.5 66 $624,000 $499,200 $561,600 $686,400 Employees are paid for 8 hrs work per day. 60 employees are employeed currently. 39 Layoff Carrying cost per year divided by 4, multiplied by 1,000 Basic on negative deviation from target. $499,200 $561,600 $686,400 40 Inventory Carry Cost 41 Stockout Cost 42 Quarter Budget $624,000 43 44 45 Aggregate Plan Simulation Worksheet Total Cost of Plan $2.371,200 Actual Costs + A B C D E F G H M N N 1 2 3 Simulation Worksheet Qtr Wk Lines Scheduled Overtime Scheduled (hours) Beginning Inventory Scheduled Production Forecast Demand Actual Demand Actual (1,000 Cases) Production Actual Ending Inventory 4 200.0 237.4 274.8 312.2 191.3 191.3 191.3 191.3 1 2 3 4 5 6 1st 7 8 349.6 2.5 191.3 5 6 7 8 9 10 11 12 13 14 15 16 17 18 19 20 21 22 23 24 25 26 27 28 29 30 31 32 33 34 35 36 37 38 39 40 41 42 9 10 11 12 13 14 15 16 17 18 19 2nd 20 21 22 23 24 25 26 27 28 29 30 31 32 3rd 33 34 35 36 37 38 10 10 10 10 10 10 10 10 10 10 10 10 10 8 8 8 8 8 8 8 8 8 8 8 8 8 8 9 9 9 9 9 9 9 9 9 9 9 9 9 9 9 1 1 1 1 1 1 1 1 1 1 1 1 1 1 1 1 1 1 1 1 1 1 1 1 1 1 1 1 2 2 2 2 2 2 2 2 2 2 2 2 387.0 424.4 461.8 499.2 536.6 574.0 611.4 648.8 686.3 670.0 653.8 637.6 621.3 605.1 588.9 572.6 556.4 540.2 523.9 507.7 491.5 475.3 475.3 475.4 475.5 475.5 475.6 475.7 475.7 475.8 475.9 475.9 476.0 191.3 191.3 191.3 191.3 191.3 191.3 191.3 191.3 191.3 191.3 191.3 191.3 191.3 153.0 153.0 153.0 153.0 153.0 153.0 153.0 153.0 153.0 153.0 153.0 153.0 153.0 192.4 192.4 192.4 192.4 1924 1924 192.4 192.4 192.4 192.4 192.4 192.4 153.8 153.8 153.8 153.8 153.8 153.8 153.8 153.8 153.8 153.8 153.8 153.8 153.8 169.2 169.2 169.2 169.2 169.2 169.2 169.2 169.2 169.2 169.2 169.2 169.2 169.2 192.3 192.3 192.3 192.3 192.3 192.3 192.3 192.3 192.3 192.3 1923 192.3 Expected Ending Inventory 237.4 274.8 3122 349.6 387.0 424.4 461.8 499.2 536.6 574.0 611.4 648.8 686.3 670.0 653.8 637.6 621.3 605.1 588.9 572.6 556.4 540.2 523.9 507.7 491.5 475.3 475.3 475.4 475.5 475.5 475.6 475.7 475.7 475.8 475.9 475.9 476.0 476.1 Expected Actual Weeks-of- Production Rate Supply (cases/hour) 1.5 450 1.8 450 2.0 450 23 450 450 2.8 450 3.0 450 3.2 450 3.4 450 3.6 450 3.7 450 3.9 450 4.1 450 4.0 450 3.9 450 3.8 450 3.7 450 3.6 450 3.5 450 3.4 450 3.2 450 3.1 450 2.9 450 2.8 450 2.6 450 2.5 450 2.5 450 2.5 450 2.5 450 2.5 450 2.5 450 2.5 450 2.5 450 2.4 450 2.4 450 2.4 450 2.4 450 2.4 450 191.3 191.3 191.3 191.3 191.3 191.3 191.3 191.3 153.0 153.0 153.0 153.0 153.0 153.0 153.0 153.0 153.0 153.0 153.0 153.0 153.0 192.4 192.4 192.4 192.4 1924 1924 192.4 192.4 192.4 192.4 192.4 192.4 0.0 0.0 0.0 0.0 0.0 0.0 0.0 0.0 0.0 0.0 0.0 0.0 0.0 0.0 0.0 0.0 0.0 0.0 0.0 0.0 0.0 0.0 0.0 0.0 0.0 0.0 0.0 0.0 0.0 0.0 0.0 0.0 0.0 0.0 0.0 0.0 0.0 0.0 2.4 2.4 2.4 2.3 2.4 2.4 2.4 2.5 36 37 38 39 40 41 42 43 44 45 4th 46 47 48 49 50 51 52 9 9 9 9 9 9 11 11 11 11 11 11 11 11 11 11 11 11 11 2 2 2 2 1 1 1 1 1 1 1 1 1 1 1 1 1 475.9 475.9 476.0 476.1 476.1 482.7 489.2 495.7 502.2 508.8 515.3 521.8 528.4 534.9 541.4 547.9 554.5 192.4 192.4 192.4 192.4 210.4 210.4 210.4 210.4 210.4 210.4 210.4 210.4 210.4 210.4 210.4 210.4 210.4 192.3 192.3 192.3 192.3 203.8 203.8 203.8 203.8 203.8 203.8 203.8 203.8 203.8 203.8 203.8 203.8 203.8 169.2 169.2 169.2 169.2 169.2 169.2 169.2 169.2 169.2 169.2 169.2 169.2 169.2 475.9 476.0 476.1 476.1 482.7 489.2 495.7 502.2 508.8 515.3 521.8 528.4 534.9 541.4 547.9 554.5 561.0 2.5 2.5 2.6 2.7 2.8 2.9 3.0 3.2 3.3 450 450 450 450 450 450 450 450 450 450 450 450 450 450 450 450 450 192.4 192.4 192.4 192.4 210.4 210.4 210.4 210.4 210.4 210.4 210.4 210.4 210.4 210.4 210.4 210.4 210.4 0.0 0.0 0.0 0.0 0.0 0.0 0.0 0.0 0.0 0.0 0.0 0.0 0.0 0.0 0.0 0.0 0.0 40 41 42 43 44 45 46 47 48 49 50 51 52 53 54 55 56 57 58 59 60 61 62 63 64 65 66 67 68 69 70 71 72 73 74 75 5th Aggregate Plan Simulation Worksheet Actual Costs + A B C D E LL F G H J 3 1 2 3 Actual Costs Cumulative 5 O co 0 O 000 UA 7 8 9 10 11 12 13 14 15 16 17 18 19 20 21 22 23 24 OOO Regular Overtime Inventory Qtr Wk Production Production Carrying Cost Cost Cost 1 48,000 9,000 0 2 48,000 9,000 0 3 48,000 9,000 0 4 48,000 9,000 0 5 48,000 9,000 0 6 48,000 9,000 0 1st 7 48,000 9,000 0 8 48,000 9,000 0 9 48,000 9,000 0 10 48,000 9,000 0 11 48,000 9,000 0 12 48,000 9,000 0 13 48,000 9,000 0 14 38,400 7,200 0 15 38,400 7,200 0 16 38,400 7,200 0 17 38,400 7,200 0 18 38,400 7,200 0 19 38,400 7,200 0 2nd 20 38,400 7,200 0 21 38,400 7,200 0 22 38,400 7,200 0 23 38,400 7,200 0 24 38,400 7,200 0 25 38,400 7,200 0 26 38,400 7,200 0 27 43,200 16,200 0 28 43,200 16,200 0 29 43,200 16,200 0 30 43,200 16,200 0 31 43,200 16,200 0 32 43,200 16,200 0 3rd 33 43,200 16,200 0 34 43,200 16,200 0 35 43,200 16,200 0 36 43,200 16,200 0 37 43,200 16,200 0 38 43,200 16,200 0 39 43,200 16,200 0 Aggregate Plan Simulation Worksheet Stockout Hiring and Cost Training Layoff Cost Cost 0 0 0 0 0 0 0 0 0 0 0 0 0 0 0 0 0 0 0 0 0 0 0 0 0 0 0 0 0 0 0 0 0 0 0 0 0 0 0 0 0 36,000 0 0 0 0 0 0 0 0 0 0 0 0 0 0 0 0 0 0 0 0 0 0 0 0 0 0 0 0 0 0 0 0 0 0 0 30,000 0 0 0 0 0 0 0 0 0 0 0 0 0 0 0 0 0 0 0 0 0 0 0 0 0 0 0 0 0 0 0 0 0 0 0 0 Actual Costs Total For Week 57,000 57,000 57,000 57,000 57,000 57,000 57,000 57,000 57,000 57,000 57,000 57,000 57,000 81,600 45,600 45,600 45,600 45,600 45,600 45,600 45,600 45,600 45,600 45,600 45,600 45,600 89,400 59,400 59,400 59,400 59,400 59,400 59,400 59,400 59,400 59,400 59,400 59,400 59,400 57,000 114,000 171,000 228,000 285,000 342,000 399,000 456,000 513,000 570,000 627,000 684,000 741,000 822,600 868,200 913,800 959,400 1,005,000 1,050,600 1,096,200 1,141,800 1,187,400 1,233,000 1,278,600 1,324,200 1,369,800 1,459,200 1,518,600 1,578,000 1,637,400 1,696,800 1,756,200 1,815,600 1,875,000 1,934,400 1,993,800 2,053,200 2,112,600 2,172,000 25 O O O 26 27 28 29 30 31 32 33 34 35 36 37 38 39 40 41 42 43 OOO 0 0 0 0 0 60,000 to oo No5 . 36 37 38 39 40 41 42 43 44 45 46 47 48 49 50 51 52 53 54 55 56 57 58 59 60 32 rd 33 34 35 36 37 38 39 40 41 42 43 44 45 4th 46 47 48 49 50 51 52 43,200 43,200 43,200 43,200 43,200 43,200 43,200 43,200 52,800 52,800 52,800 52,800 52,800 52,800 52,800 52,800 52,800 52,800 52,800 52,800 52,800 16,200 16,200 16,200 16,200 16,200 16,200 16,200 16,200 9,900 9,900 9,900 9,900 9,900 9,900 9,900 9,900 9,900 9,900 9,900 9,900 9,900 0 0 0 0 0 0 0 0 0 0 0 0 0 0 0 0 0 0 0 0 0 0 0 0 0 0 0 0 0 0 0 0 0 0 0 0 0 0 0 0 0 0 0 0 0 0 0 0 0 0 0 0 0 0 0 0 0 59,400 59,400 59,400 59,400 59,400 59,400 59,400 59,400 122,700 62,700 62,700 62,700 62,700 62,700 62,700 62,700 62,700 62,700 62,700 62,700 62,700 1,756,200 1,815,600 1,875,000 1,934,400 1,993,800 2,053,200 2,112,600 2,172,000 2,294,700 2,357,400 2,420,100 2,482,800 2,545,500 2,608,200 2,670,900 2,733,600 2,796,300 2,859,000 2,921,700 2,984,400 3,047,100 0 0 0 0 0 0 0 Aggregate Plan Simulation Worksheet Actual Costs Bradford Manufacturing - Planning Plant Production 4 1,000 case units. Quarter (Week Numbers) 2nd (14-26) 3rd (27-39) 2,200 2,500 385 408 1st (1-13) 2,000 338 Forecast Demand Ending Inventory Target 4th (40-52) 2,650 338 1st (Next Year) Notes 2,200 Each number is a 13 week forecast. This is calculated based on 6 weeks of future forecast demand. Notes Forecast Demand by Quarter (1,000 Case Units) Numbers Units of measure 60 employees 6 450 Cases per hour $20.00 per hour $30.00 per hour 7.5 hours 2 hours $1.00 per case (per year) $2.40 per case $5,000.00 per employee $3,000.00 per employee 3,000 2,500 2,000 1,500 1,000 500 0 1st (1-13) 2nd (14-26) 3rd (27-39) 4th (40-52) 1st (Next Year) 9 Planning Data 10 Initial number of employees 11 Emplyees per line 12 Standard production rate (each line) 13 Employee pay rate 14 Overtime pay rate 15 Standard hours per shift 16 Maximum overtime per day 17 Inventory carry cost 18 Stockout cost 19 Employee hiring and training cost 20 Employee layoff cost 21 22 Aggregate Plan 23 24 Lines run 25 Overtime hours per day 26 27 Beginning Inventory 28 Production 29 Expected Demand 30 Ending Inventory 31 32 Deviation from Inventory Target 33 Employees 34 35 Cost of Plan 36 Labor Regular Time 37 Labor Overtime 38 Hiring and Training 1st (1-13) 10 1 Quarter (Week Numbers) 2nd (14-26) 3rd (27-39) 8 9 1 2 4th (40-52) 11 1 Notes Construct solution here 200.0 2.486.3 2.000.0 686.3 686.3 1,989.0 2,200.0 475.3 475.3 2,500.9 2,500.0 476.1 476.1 2,734.9 2,650.0 561.0 347.8 60 90.6 48 68.4 54 222.5 66 $624,000 $499,200 $561,600 $686,400 Employees are paid for 8 hrs work per day. 60 employees are employeed currently. 39 Layoff Carrying cost per year divided by 4, multiplied by 1,000 Basic on negative deviation from target. $499,200 $561,600 $686,400 40 Inventory Carry Cost 41 Stockout Cost 42 Quarter Budget $624,000 43 44 45 Aggregate Plan Simulation Worksheet Total Cost of Plan $2.371,200 Actual Costs + A B C D E F G H M N N 1 2 3 Simulation Worksheet Qtr Wk Lines Scheduled Overtime Scheduled (hours) Beginning Inventory Scheduled Production Forecast Demand Actual Demand Actual (1,000 Cases) Production Actual Ending Inventory 4 200.0 237.4 274.8 312.2 191.3 191.3 191.3 191.3 1 2 3 4 5 6 1st 7 8 349.6 2.5 191.3 5 6 7 8 9 10 11 12 13 14 15 16 17 18 19 20 21 22 23 24 25 26 27 28 29 30 31 32 33 34 35 36 37 38 39 40 41 42 9 10 11 12 13 14 15 16 17 18 19 2nd 20 21 22 23 24 25 26 27 28 29 30 31 32 3rd 33 34 35 36 37 38 10 10 10 10 10 10 10 10 10 10 10 10 10 8 8 8 8 8 8 8 8 8 8 8 8 8 8 9 9 9 9 9 9 9 9 9 9 9 9 9 9 9 1 1 1 1 1 1 1 1 1 1 1 1 1 1 1 1 1 1 1 1 1 1 1 1 1 1 1 1 2 2 2 2 2 2 2 2 2 2 2 2 387.0 424.4 461.8 499.2 536.6 574.0 611.4 648.8 686.3 670.0 653.8 637.6 621.3 605.1 588.9 572.6 556.4 540.2 523.9 507.7 491.5 475.3 475.3 475.4 475.5 475.5 475.6 475.7 475.7 475.8 475.9 475.9 476.0 191.3 191.3 191.3 191.3 191.3 191.3 191.3 191.3 191.3 191.3 191.3 191.3 191.3 153.0 153.0 153.0 153.0 153.0 153.0 153.0 153.0 153.0 153.0 153.0 153.0 153.0 192.4 192.4 192.4 192.4 1924 1924 192.4 192.4 192.4 192.4 192.4 192.4 153.8 153.8 153.8 153.8 153.8 153.8 153.8 153.8 153.8 153.8 153.8 153.8 153.8 169.2 169.2 169.2 169.2 169.2 169.2 169.2 169.2 169.2 169.2 169.2 169.2 169.2 192.3 192.3 192.3 192.3 192.3 192.3 192.3 192.3 192.3 192.3 1923 192.3 Expected Ending Inventory 237.4 274.8 3122 349.6 387.0 424.4 461.8 499.2 536.6 574.0 611.4 648.8 686.3 670.0 653.8 637.6 621.3 605.1 588.9 572.6 556.4 540.2 523.9 507.7 491.5 475.3 475.3 475.4 475.5 475.5 475.6 475.7 475.7 475.8 475.9 475.9 476.0 476.1 Expected Actual Weeks-of- Production Rate Supply (cases/hour) 1.5 450 1.8 450 2.0 450 23 450 450 2.8 450 3.0 450 3.2 450 3.4 450 3.6 450 3.7 450 3.9 450 4.1 450 4.0 450 3.9 450 3.8 450 3.7 450 3.6 450 3.5 450 3.4 450 3.2 450 3.1 450 2.9 450 2.8 450 2.6 450 2.5 450 2.5 450 2.5 450 2.5 450 2.5 450 2.5 450 2.5 450 2.5 450 2.4 450 2.4 450 2.4 450 2.4 450 2.4 450 191.3 191.3 191.3 191.3 191.3 191.3 191.3 191.3 153.0 153.0 153.0 153.0 153.0 153.0 153.0 153.0 153.0 153.0 153.0 153.0 153.0 192.4 192.4 192.4 192.4 1924 1924 192.4 192.4 192.4 192.4 192.4 192.4 0.0 0.0 0.0 0.0 0.0 0.0 0.0 0.0 0.0 0.0 0.0 0.0 0.0 0.0 0.0 0.0 0.0 0.0 0.0 0.0 0.0 0.0 0.0 0.0 0.0 0.0 0.0 0.0 0.0 0.0 0.0 0.0 0.0 0.0 0.0 0.0 0.0 0.0 2.4 2.4 2.4 2.3 2.4 2.4 2.4 2.5 36 37 38 39 40 41 42 43 44 45 4th 46 47 48 49 50 51 52 9 9 9 9 9 9 11 11 11 11 11 11 11 11 11 11 11 11 11 2 2 2 2 1 1 1 1 1 1 1 1 1 1 1 1 1 475.9 475.9 476.0 476.1 476.1 482.7 489.2 495.7 502.2 508.8 515.3 521.8 528.4 534.9 541.4 547.9 554.5 192.4 192.4 192.4 192.4 210.4 210.4 210.4 210.4 210.4 210.4 210.4 210.4 210.4 210.4 210.4 210.4 210.4 192.3 192.3 192.3 192.3 203.8 203.8 203.8 203.8 203.8 203.8 203.8 203.8 203.8 203.8 203.8 203.8 203.8 169.2 169.2 169.2 169.2 169.2 169.2 169.2 169.2 169.2 169.2 169.2 169.2 169.2 475.9 476.0 476.1 476.1 482.7 489.2 495.7 502.2 508.8 515.3 521.8 528.4 534.9 541.4 547.9 554.5 561.0 2.5 2.5 2.6 2.7 2.8 2.9 3.0 3.2 3.3 450 450 450 450 450 450 450 450 450 450 450 450 450 450 450 450 450 192.4 192.4 192.4 192.4 210.4 210.4 210.4 210.4 210.4 210.4 210.4 210.4 210.4 210.4 210.4 210.4 210.4 0.0 0.0 0.0 0.0 0.0 0.0 0.0 0.0 0.0 0.0 0.0 0.0 0.0 0.0 0.0 0.0 0.0 40 41 42 43 44 45 46 47 48 49 50 51 52 53 54 55 56 57 58 59 60 61 62 63 64 65 66 67 68 69 70 71 72 73 74 75 5th Aggregate Plan Simulation Worksheet Actual Costs + A B C D E LL F G H J 3 1 2 3 Actual Costs Cumulative 5 O co 0 O 000 UA 7 8 9 10 11 12 13 14 15 16 17 18 19 20 21 22 23 24 OOO Regular Overtime Inventory Qtr Wk Production Production Carrying Cost Cost Cost 1 48,000 9,000 0 2 48,000 9,000 0 3 48,000 9,000 0 4 48,000 9,000 0 5 48,000 9,000 0 6 48,000 9,000 0 1st 7 48,000 9,000 0 8 48,000 9,000 0 9 48,000 9,000 0 10 48,000 9,000 0 11 48,000 9,000 0 12 48,000 9,000 0 13 48,000 9,000 0 14 38,400 7,200 0 15 38,400 7,200 0 16 38,400 7,200 0 17 38,400 7,200 0 18 38,400 7,200 0 19 38,400 7,200 0 2nd 20 38,400 7,200 0 21 38,400 7,200 0 22 38,400 7,200 0 23 38,400 7,200 0 24 38,400 7,200 0 25 38,400 7,200 0 26 38,400 7,200 0 27 43,200 16,200 0 28 43,200 16,200 0 29 43,200 16,200 0 30 43,200 16,200 0 31 43,200 16,200 0 32 43,200 16,200 0 3rd 33 43,200 16,200 0 34 43,200 16,200 0 35 43,200 16,200 0 36 43,200 16,200 0 37 43,200 16,200 0 38 43,200 16,200 0 39 43,200 16,200 0 Aggregate Plan Simulation Worksheet Stockout Hiring and Cost Training Layoff Cost Cost 0 0 0 0 0 0 0 0 0 0 0 0 0 0 0 0 0 0 0 0 0 0 0 0 0 0 0 0 0 0 0 0 0 0 0 0 0 0 0 0 0 36,000 0 0 0 0 0 0 0 0 0 0 0 0 0 0 0 0 0 0 0 0 0 0 0 0 0 0 0 0 0 0 0 0 0 0 0 30,000 0 0 0 0 0 0 0 0 0 0 0 0 0 0 0 0 0 0 0 0 0 0 0 0 0 0 0 0 0 0 0 0 0 0 0 0 Actual Costs Total For Week 57,000 57,000 57,000 57,000 57,000 57,000 57,000 57,000 57,000 57,000 57,000 57,000 57,000 81,600 45,600 45,600 45,600 45,600 45,600 45,600 45,600 45,600 45,600 45,600 45,600 45,600 89,400 59,400 59,400 59,400 59,400 59,400 59,400 59,400 59,400 59,400 59,400 59,400 59,400 57,000 114,000 171,000 228,000 285,000 342,000 399,000 456,000 513,000 570,000 627,000 684,000 741,000 822,600 868,200 913,800 959,400 1,005,000 1,050,600 1,096,200 1,141,800 1,187,400 1,233,000 1,278,600 1,324,200 1,369,800 1,459,200 1,518,600 1,578,000 1,637,400 1,696,800 1,756,200 1,815,600 1,875,000 1,934,400 1,993,800 2,053,200 2,112,600 2,172,000 25 O O O 26 27 28 29 30 31 32 33 34 35 36 37 38 39 40 41 42 43 OOO 0 0 0 0 0 60,000 to oo No5 . 36 37 38 39 40 41 42 43 44 45 46 47 48 49 50 51 52 53 54 55 56 57 58 59 60 32 rd 33 34 35 36 37 38 39 40 41 42 43 44 45 4th 46 47 48 49 50 51 52 43,200 43,200 43,200 43,200 43,200 43,200 43,200 43,200 52,800 52,800 52,800 52,800 52,800 52,800 52,800 52,800 52,800 52,800 52,800 52,800 52,800 16,200 16,200 16,200 16,200 16,200 16,200 16,200 16,200 9,900 9,900 9,900 9,900 9,900 9,900 9,900 9,900 9,900 9,900 9,900 9,900 9,900 0 0 0 0 0 0 0 0 0 0 0 0 0 0 0 0 0 0 0 0 0 0 0 0 0 0 0 0 0 0 0 0 0 0 0 0 0 0 0 0 0 0 0 0 0 0 0 0 0 0 0 0 0 0 0 0 0 59,400 59,400 59,400 59,400 59,400 59,400 59,400 59,400 122,700 62,700 62,700 62,700 62,700 62,700 62,700 62,700 62,700 62,700 62,700 62,700 62,700 1,756,200 1,815,600 1,875,000 1,934,400 1,993,800 2,053,200 2,112,600 2,172,000 2,294,700 2,357,400 2,420,100 2,482,800 2,545,500 2,608,200 2,670,900 2,733,600 2,796,300 2,859,000 2,921,700 2,984,400 3,047,100 0 0 0 0 0 0 0 Aggregate Plan Simulation Worksheet Actual Costs