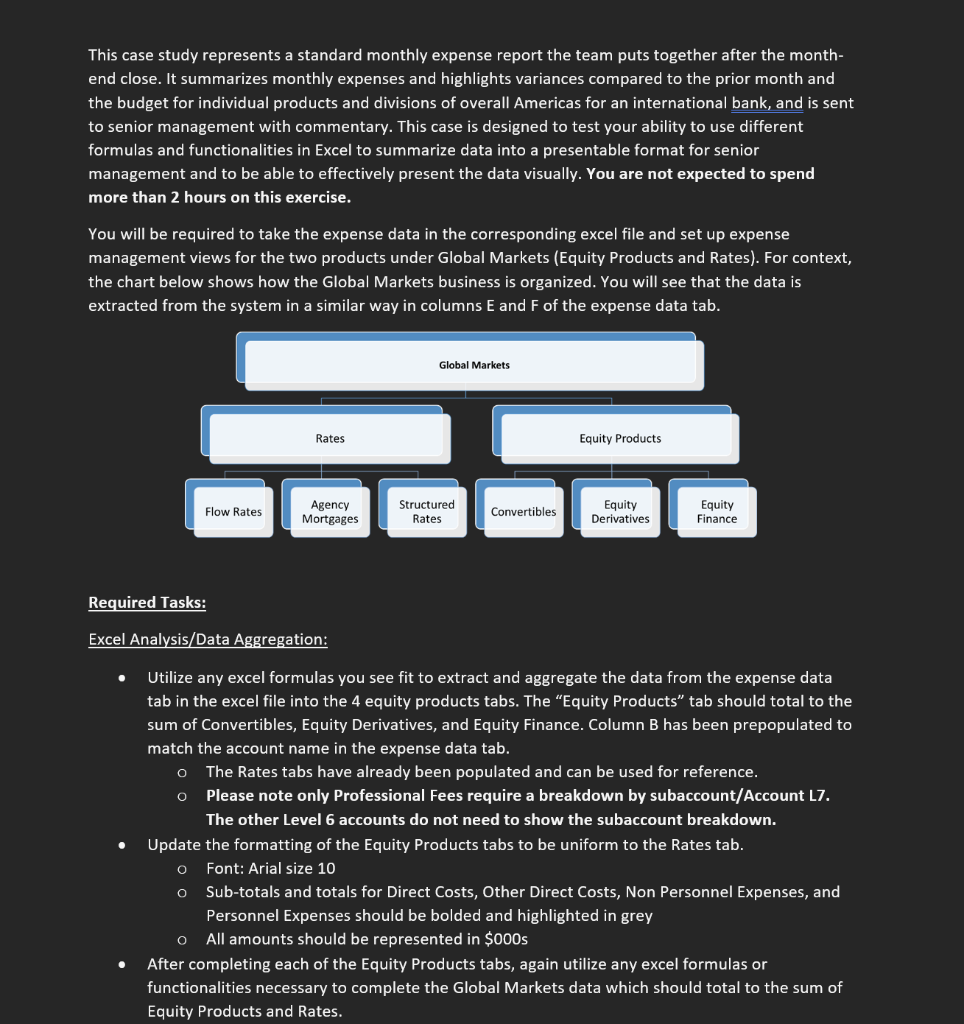
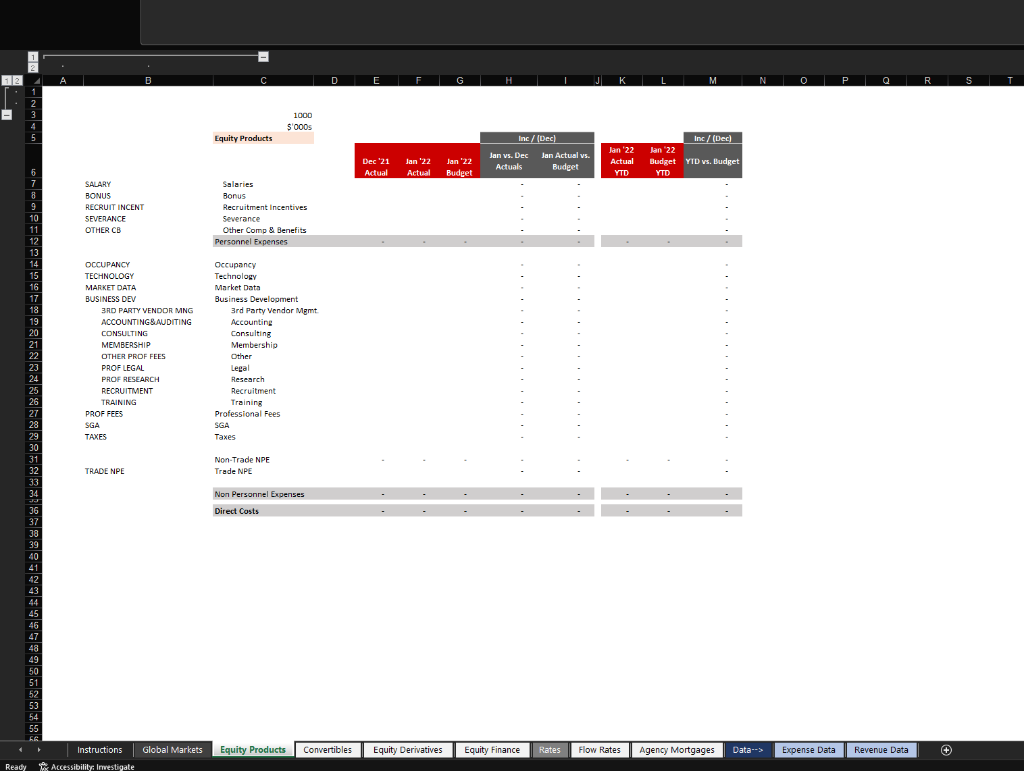
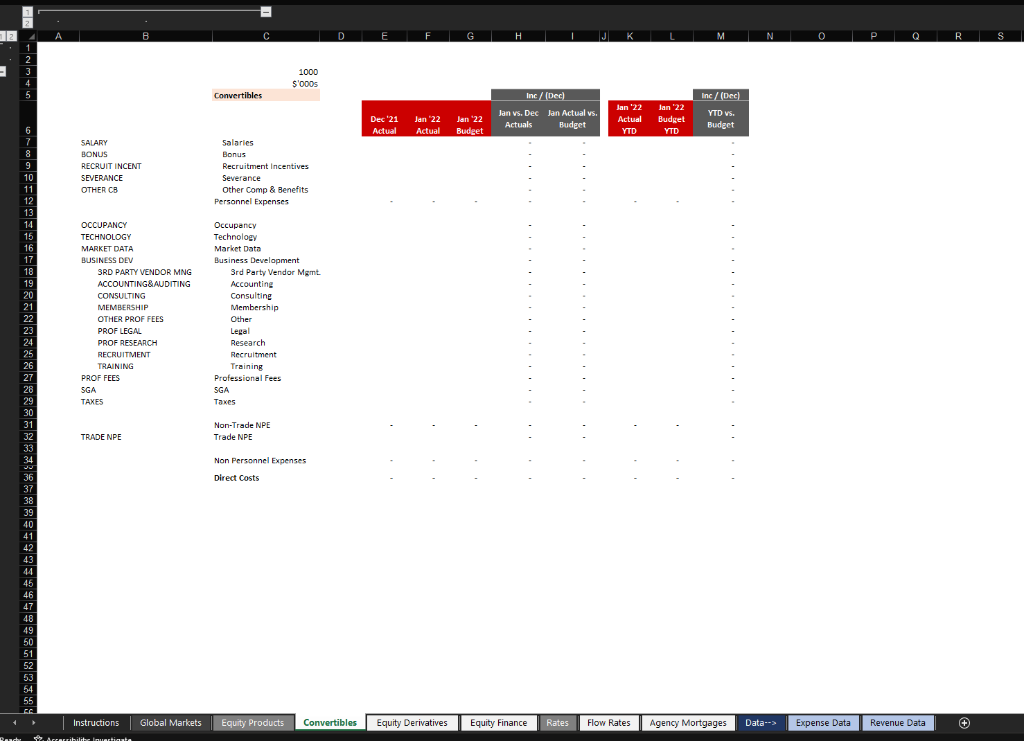
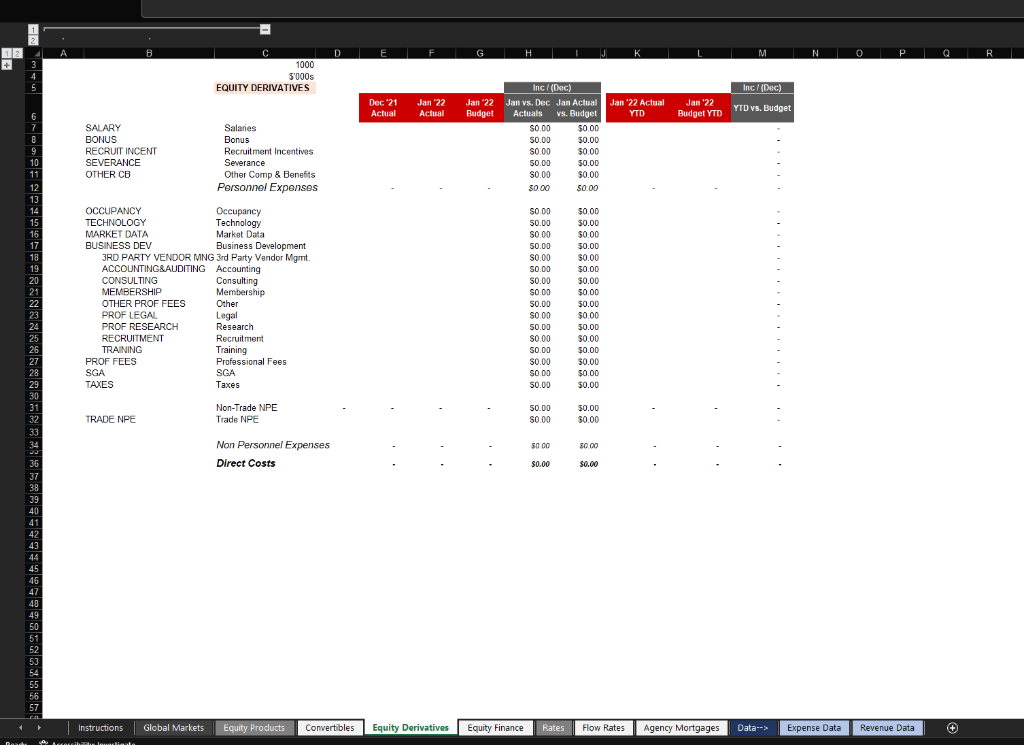
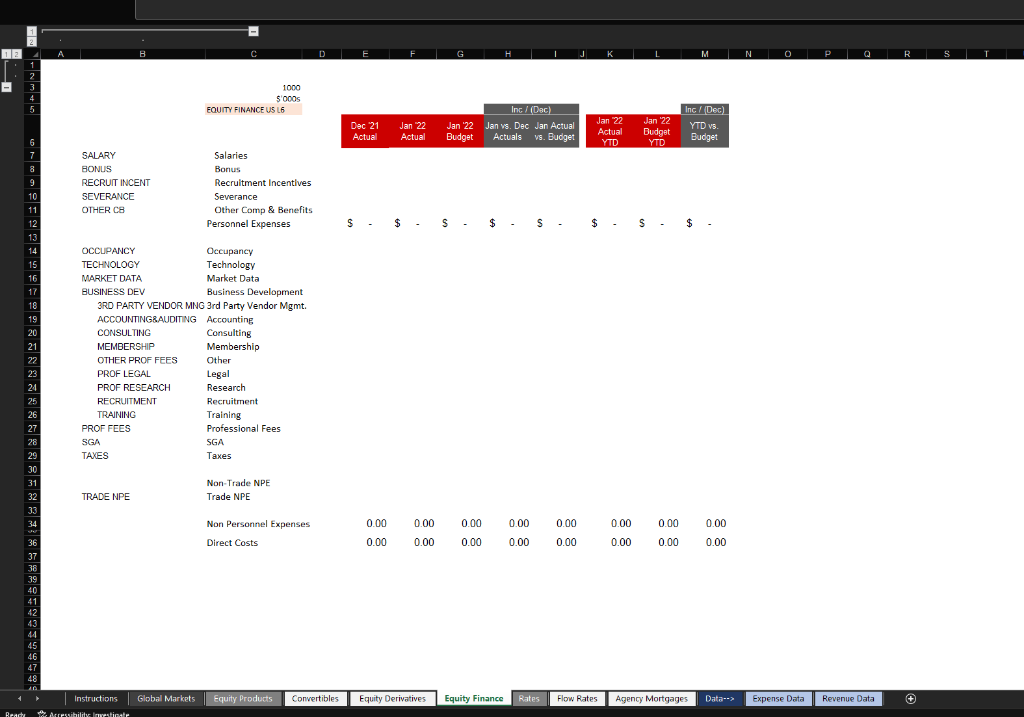
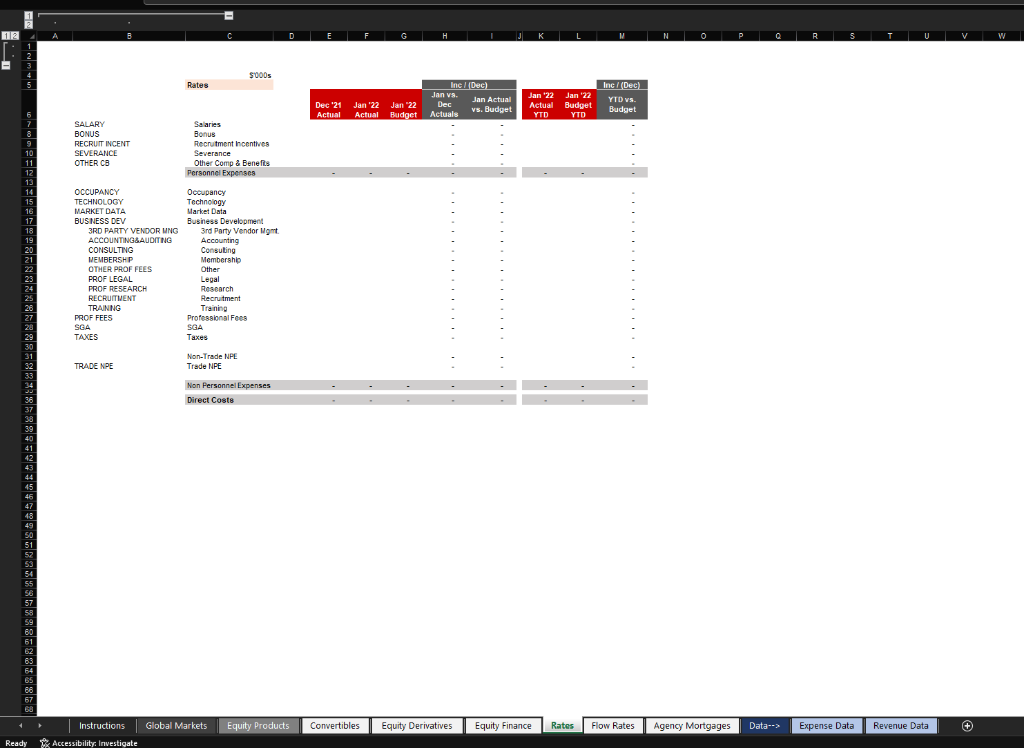

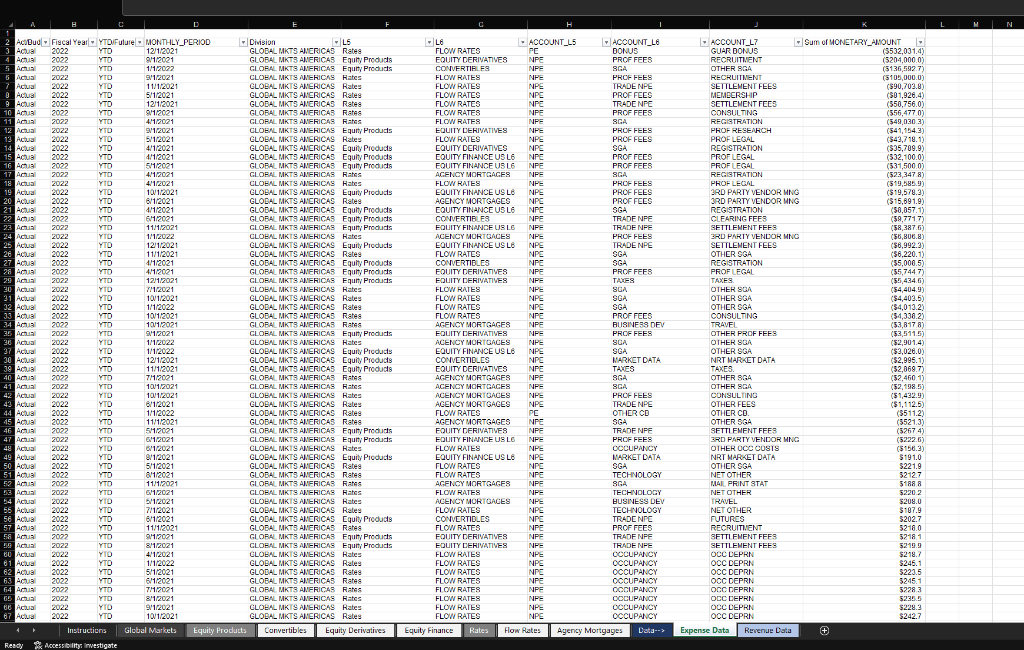
This case study represents a standard monthly expense report the team puts together after the month- end close. It summarizes monthly expenses and highlights variances compared to the prior month and the budget for individual products and divisions of overall Americas for an international bank, and is sent to senior management with commentary. This case is designed to test your ability to use different formulas and functionalities in Excel to summarize data into a presentable format for senior management and to be able to effectively present the data visually. You are not expected to spend more than 2 hours on this exercise. You will be required to take the expense data in the corresponding excel file and set up expense management views for the two products under Global Markets (Equity Products and Rates). For context, the chart below shows how the Global Markets business is organized. You will see that the data is extracted from the system in a similar way in columns E and F of the expense data tab. a Global Markets Rates Equity Products Flow Rates Agency Mortgages Structured Rates Convertibles Equity Derivatives Equity Finance Required Tasks: Excel Analysis/Data Aggregation: 0 Utilize any excel formulas you see fit to extract and aggregate the data from the expense data tab in the excel file into the 4 equity products tabs. The "Equity Products tab should total to the sum of Convertibles, Equity Derivatives, and Equity Finance. Column B has been prepopulated to match the account name in the expense data tab. o The Rates tabs have already been populated and can be used for reference. Please note only Professional Fees require a breakdown by subaccount/Account L7. The other Level 6 accounts do not need to show the subaccount breakdown. Update the formatting of the Equity Products tabs to be uniform to the Rates tab. Font: Arial size 10 Sub-totals and totals for Direct Costs, Other Direct Costs, Non Personnel Expenses, and Personnel Expenses should be bolded and highlighted in grey All amounts should be represented in $000s After completing each of the Equity Products tabs, again utilize any excel formulas or functionalities necessary to complete the Global Markets data which should total to the sum of Equity Products and Rates. O o O E M Q R. 1000 Sooos Equity Products Inc / Dec Jan vs. Des Jan Actual vs. Actuals Budget Dec 21 Actual Inc/ (Dec Jan 22 Budget YTD vs. Budget YTD Jan 22 Actual Jan 22 Actual YTD Jan 22 Budget Salaries SALARY BONUS RECRUIT INCENT SEVERANCE OTHER CB Bonus Recruitment Incentives Severance Other Comp & Benefits Personnel Expenses 6 7 8 9 10 11 12 13 14 15 16 17 18 19 20 21 22 23 24 25 26 27 28 29 30 31 32 33 34 OCCUPANCY TECHNOLOGY MARKET DATA BUSINESS DEV 3RD PARTY VENDOR MNG ACCOUNTING S.AUDITING CONSULTING MEMBERSHIP OTHER PROF FEES PROF LEGAL PROF RESEARCH RECRUITMENT TRAINING PROF FEES SGA TAXES Occupancy Technology Market Data Business Development 3rd Party Vendor Mgmt. Accounting Consulting Membership Other Legal Research Recruitment Training Professional Fees SGA Taxes TRADE NPE Non-Trade NPE Trade NPE Non Personnel Expenses Direct Costs 36 37 38 39 40 41 42 43 44 45 46 47 48 49 50 51 52 53 54 55 66 Equity Products Convertibles Equity Derivatives Equity Finance Rates Flow Rates Agency Mortgages Data--> Expense Data Revenue Data Instructions Global Markets Accessibility: Investigate Ready B C D E F G H AL M N O Q R S S - 1000 sooos Convertibles Inc/ (Dec Jan vs. Dec Jan Actual vs. Actuals Budget Dec 21 Actual Inc/ (Dec) YTD VS. Budget Jan 22 Actual Jan 22 Actual YTD Jan 22 Bac Pet Jan 22 Budget YTD SALARY BONUS RECRUIT INCENT SEVERANCE OTHER CB Salaries Bonus Recruitment Incentives Severance Other Comp & Benefits Personnel Expenses 7 8 9 10 11 12 13 14 15 16 17 18 19 20 21 22 23 24 25 26 27 28 29 30 31 32 33 34 OCCUPANCY TECHNOLOGY MARKET DATA BUSINESS DEV 3RD PARTY VENDOR MNG ACCOUNTING & AUDITING CONSULTING MEMBERSHIP OTHER PROF FEES PROF LEGAL PROF RESEARCH RECRUITMENT TRAINING PROF FEES SGA TAXES Occupancy Technoloey Market Data Business Development 3rd Party Vendor Mgmt. Accounting Consulting Membership Other Legal Research Recruitment Training Professional Fees SGA Taxes Non-Trade NPE Trade NPE TRADE NPE Non Personnel Expenses Direct Costs 36 37 38 39 40 41 42 43 45 46 47 48 49 50 51 52 53 54 55 Instructions Global Markets Equity Products Convertibles Equity Derivatives Equity Finance Rates Flow Rates Agency Mortgages Data- Expense Data Revenue Data + Pour Torrorribiliter Inunttiauto B F DE G H K M NT 0 P P 0 R 1000 5000s EQUITY DERIVATIVES Inc/(Dec) Dec 21 Actual Jan 22 Actual Jan 22 Budget YTD YTD vs. Budget SALARY BONUS RECRUIT INCENT SEVERANCE OTHER CB Salaries Bonus Recruitment Incentives Severance Other Comp & Benefits Personnel Expenses Inc. (Dach Jan 22 Jan vs. Dec Jan Actual Jan 22 Actual Budget Actuals vs. Budget YTD S0.00 $0.00 50.00 30.00 S0.00 $0.00 50.00 $0.00 S0.00 $0.00 $0.00 50.00 6 7 8 9 10 11 12 13 14 15 16 17 18 19 20 21 22 23 24. 25 26 27 28 29 30 31 32 33 34. OCCUPANCY Occupancy TECHNOLOGY Technology MARKET DATA Market Data BUSINESS DEV Business Development 3RD PARTY VENDOR MNG 3rd Party Vendor Mgmt. ACCOUNTING&AUDITING Accounting CONSULTING Consulting MEMBERSHIP Membership OTHER PROF FEES Other PROF LEGAL Lega PROF RESEARCH Research RECRUITMENT Recruitment TRAINING Training PROF FEES Professional Fees SGA SGA TAXES Taxes $0.00 50.00 SO 00 $0.00 S0.00 $0.00 $0.00 SO 00 50.00 S0.00 50.00 $0.00 S0.00 50.00 S0.00 50.00 $0.00 30.00 $0.00 $0.00 $0.00 $0.00 50.00 $0.00 $0.00 $0.00 $0.00 $0.00 $0.00 $0.00 $0.00 50.00 Non-Trade NPE Trade NPE 50.00 S0.00 $0.00 $0.00 TRADE NPE 50 00 50 00 Non Personnel Expenses Direct Costs $0.00 $0.00 35 37 38 39 40 41 42 43 44 45 46 47 48 49 50 51 52 53 54 55 56 57 Instructions Global Markets Equity Products Convertibles Equity Derivatives Equity Finance Rates Flow Rates Agency Mortgages Data--> Expense Data Revenue Data # ALI ilumina B D E G J K L M N 0 R ST 1000 $ 000 EQUITY FINANCE USL6 Dec 21 Actual Jan 22 Actual Inc / (Dec) Jan 22 Jan vs. Dec Jan Actual Budget Actuals vs. Budget Jan 22 Actual YTD Jan 22 Budget YTD Inc / Dec) YTD vs. Budget SALARY BONUS RECRUIT INCENT SEVERANCE OTHER CE Salaries Bonus Recruitment Incentives Severance Other Comp & Benefits Personnel Expenses S - $ . S . $. S. $ . S. $. 9 10 11 12 13 14 15 16 17 18 19 20 21 22 23 24 25 26 27 28 29 30 31 32 33 34 OCCUPANCY Occupancy TECHNOLOGY Technology MARKET DATA Market Data BUSINESS DEV Business Development 3RD PARTY VENDOR MNG 3rd Party Vendor Mgmt. ACCOUNTING&AUDITING Accounting CONSULTING Consulting MEMBERSHIP Membership OTHER PROF FEES Other PROF LEGAL Legal PROF RESEARCH Research RECRUITMENT Recruitment TRAINING Training PROF FEES Professional Fees SGA SGA TAXES Taxes TRADE NPE Non-Trade NPE Trade NPE 0.00 0.00 0.00 0.00 Non Personnel Expenses Direct Costs 0.00 0.00 0.00 0.00 0.00 0.00 0.00 0.00 0.00 0.00 0.00 0.00 36 37 38 39 40 41 42 43 44 45 46 47 48 Instructions Global Markets Equity Products Convertibles Equity Derivatives Equity Finance Rates Flow Rates Agency Mortgages Data--> Expense Data Revenue Data Rear the Arressibility Investimate 12 B F H NO Q R U VW $000s Rates Inc Dec) Jan Vs. Jan Actual Dec 21 Jan 22 Jan 22 Dec Actual vs. Budget Actual Budget Actuals Jan 22 Jan 22 Actual Budget YTD YTD Inc/(Dec YTD VS. Budget SALARY BONUS RECRUIT INCENT SEVERANCE OTHER CB 10 11 12 13 14 15 16 17 Salaries Bonus Recruitment Incentives Severance Other Comp & Benefits Personnel Expenses Occupancy Technology Market Data Business Development 3rd Party Vendor Mgmt Accounting Consulting Membership Other Legal Research Recruitment Training Professional Fees SGA Taxes OCCUPANCY TECHNOLOGY MARKET DATA BUSINESS DEV 3RD PARTY VENOOR MNG ACCOUNTING&AUDITING CONSULTING WEMBERSHP OTHER PROF FEES PROF LEGAL PROF RESEARCH RECRUITMENT TRAINING PROF FEES SGA TAXES 19 TRADE NPE Non-Trade NPL Trade NPE Non Personnel Expenses Direct Costs 47 48 49 50 51 52 53 54 57 61 63 64 65 66 67 68 Instructions Global Markets Equity Products Convertibles Equity Derivatives Equity Finance Rates Flow Rates Agency Mortgages Data--> Expense Data Revenue Data + Ready Accessibility Investigate D N 0 R S **Figures shown here can be used to compare your work once you over ride with formulas SOODS FLOW RATES Inc / (Dec) YTD VS. Dec 21 Jan 22 Actual Actual 1.566 1,649 3.945 3,811 36 117 Inc / (Dec) Jan 22 Jan vs. Dec Jan Actual Actuals Budget vs. Budget 1.875 83 (226) 4,583 (135) (773) 25 81 92 Jan 22 Actual YTD 16.626 43,482 151 Jan 22 Budget YTD 18,750 45.833 250 Budget (2.124) SALARY BONUS RECRUIT INCENT SEVERANCE OTHER CB (99) Salanes Bonus Recruitment Incentives Severance Other Comp & Benefits Personnel Expenses 303 5,851 444 6,021 375 6,858 141 170 69 4,687 3.750 (837) 54,94568,583 12 13 (3,638) 15 16 17 18 19 90 113 459 65 92 83 398 103 1 84 130 450 110 0 2 (30) 1601 18 1 9 (46) 1521 (6) 1 900 1.274 4.577 604 2 2 4 116 7 838 1.296 4.500 1,097 2 a $8.5E sk****, 5.85333 8 8 12 6 6 1 1 (8) 8) (3) (6) 8 8 OCCUPANCY Occupancy TECHNOLOGY Technology MARKET DATA Market Data BUSINESS DEV Business Development 3RD PARTY VENDOR MING 3rd Party Vendor Mgmt ACCOUNTINGRAUDITING Accounting CONSULTING Consulting MEMBERSHIP Membership OTHER PROF FEES Other PROF LEGAL Legal PROF RESEARCH Research RECRUITMENT Recruitment TRAINING Training PROF FEES Professional Fees SGA SGA TAXES Taxes 58 8 9 3 29 68 42 322 292 71 - - - 22 60 39 81 34 10 25 1 62 42 58 58 (26) (29) (25) (1) 19 (8) (48) 280 5 737 475 354 250 8 618 417 583 Non-Trade NPE Trade NPE 36a 5,357 802 6,006 935 4.900 (66) 648 (133) 1,106 9.119 54,732 9,348 49,000 TRADE NPE 682 Non Personnel Expenses Direct Costs 6,225 6,807 5,835 12,076 12,828 12,693 973 63,901 58,348 135 128,847 126,932 5,553 1,915 752 40 41 42 43 44 45 46 47 48 49 54 55 Instructions Global Markets Equity Products Convertibles Equity Derivatives Equity Finance Rates Flow Rates Agency Mortgages Data-> Expense Data Revenue Data Padu 9. decerril e Imuniste H L N 030 PROFFCES Actbud - Fiscal Year - YTD Future - MONTHLY_PERIOD Division L5 Actus 2022 YTD 12/1/2021 GLOBAL MKTS AMERICAS Rates 4 AM 2022 YTO 9/1/2021 GLOBAL MKTS ANERICAS Equity Products 5 Act 2022 YTO 17112022 GLOBAL MKTS AWFRICAS Equity Products 6 Adual 2022 9/172021 CLOBAL MKTS AMERICAS Rates 7 Actual 2022 YTD 11/1/2021 GLOBAL MKTS AMERICAS Rates B Anual 2022 YTD 5/1/2021 GLOBAL MKTS ANCRICAS Rates 9 AUS 2022 YTD 12/1/2021 GLOBAL MKTS ANERICAS Rates 10 Aal was 2002 971/2001 YTO GLOBAL MKTS AJERICHS Rates cu 11 AQUI 2022 YTO 412021 GLOBAL MKTS AMERICAS HA 12 oua 2022 YTD 9/1/2021 GLOBAL MKTS AMERICAS Equity Products 13 Actual 2022 YTP 5/1/2021 GLOBAL MKTS AMERICAS Rates 14 Acua 2022 YTO 4/1/202 GLOBAL MKTS ANERICAS Equity Products 15 AGUS 2022 47112021 GLOBAL MKTS ANERICAS Equity Products 16 A 2022 YTO 5112021 GLOBAL MKTS ANERICAS Equilty Products 17 AG 2022 YTD 4112001 GLOBAL MKTS AMERICAS Rates 18 Adual 2022 YTD 4/1/2021 CLOBAL MKTS AMERICAS Rates 19 Actual 2022 YTD 10/1/2021 GLOBAL MKTS ANERICAS Equity Products 20 AG 2022 YTD 6/1/2021 GLOBAL MKTS AMERICAS Rates 21 ACUN 2022 YTO 4/1/2021 GLOBAL MKTS ANERICAS Equity Products 22 Anal 2022 YTO 6/1/2021 GLOBAL MKTS ANERICAS Equilty Products 23 Actual 2022 YTD 11/1/2021 GLOBAL MKTS AMERICAS Equny Products 24 Actual 2022 YTD 1/1/2022 CLOBAL MKTS AMERICAS Hates 25 Actual 2022 YTP 12/1/2021 GLOBAL MKTS AWERICAS Equity Products 26 Au 2022 YTO 11/1/2021 GLODAL MKTS ANCRICAS Rates 27 ADUN 2022 YTD 4/1/2021 GLOBAL MKTS AMERICAS Equity Products 28 AUS! 2022 YTO 4112021 GLOBAL MKTS ANERICAS Equity Products 25 Aral 2022 12/1/2021 GLOBAL MKTS AWERICAS Equity Products 30 Actual 2022 YTD 7/1/2021 CLOBAL MKTS AVERICAS Rates 31 Acus 2022 YTD 10/1/2021 GLOBAL MKTS ANERICAS Rates 32 Actual 2022 YTD 1/1/2022 GLOBAL MKTS ANERICAS Rates 33 ADUN 2022 YTO 10/1/2021 GLOBAL MKTS AWERICHS Rates 34 AS 2002 YTD 10/1/2021 GLOBAL MKTS AMERICAS Rates 3 A 2022 YTD 912021 GLOBAL MKTS AMERICAS Equnty Products 20 Aal 2022 YID 1/1/2022 GLOBAL MKTS AMERICAS Rates 37 Anual 2022 YTD 1/1/2022 GLOBAL MKTS ANERICAS Equity Products 30 Actual 2022 2024 YTD 12/1/2021 GLODAL MKTS AMERICAS Equity Products --- 39 Actual 2022 YTD 11/1/2021 GLOBAL MKTS AMERICAS Equity Products 40 AM 2022 YTO 7112021 GLOBAL MKTS AMERICAS Rates 41 Aqua 2022 YTD 10/1/2021 GLOBAL METSAVERICAS Rates 42 Adual 2022 YID 10/1/2021 CLOBAL MKTS AWERICAS Rates 43 Actua 2022 YTD B/1/2021 GLOBAL MKTS AWERICAS Rates 44 Acu 2022 YTO 1/1/2022 GLODAL MKTS ANERICAS Rates 45 ACUS 2022 YTD 11/1/2021 GLOBAL MKTS AMERICAS Rates 46 Antal 2022 YTO 51112021 GLOBAL MKTS AMERICAS Equity Products 47 Adual 2022 YTO 61/2021 CLOBAL MKTS AMERICAS Fauny Products 49 Actual 2022 YTD 6/1/2021 GLOBAL MKTS AMERICAS Rates 49 Actua 2022 YTD 8/1/2021 GLOBAL MKTS ANERICAS Equity Products 50 Acus 2022 YTO 511/2021 GLOBAL MKTS ACRICAS Rates 51 AM 2022 8/1/2021 GLOBAL MKTS AWERICAS Rates 52 Anal 2022 YTO 11/1/2021 GLOBAL MKTS AMERICAS Rates 53 Adual 2022 YTO 6M12021 GLOBAL MKTS AMERICAS Rates N YTD 2022 54 Adua CLOBAL MKIS AMERICAS Hates 5/1/2021 56 Actual 2022 YTD 7/1/2021 GLOBAL MKTS AWERICAS Rates 56 Actual 2022 YTO 6/1/2021 GLOBAL MKTS ANCRICAS Equity Products 57 Acus 2022 YTD 11/1/2021 GLOBAL MKTS AMERICAS Rates 58 AGUS 2022 YTO 97117021 GLOBAL MKTS AMERICAS Equity Products 59 Actual 2022 YTD 812021 GLOBAL MKTS AWERICAS Equity Products BU Actual 2022 YTD 4/1/2021 GLOBAL MKTS AMERICAS Rates 81 Actual 2022 YTD 1/1/2022 GLOBAL MKTS AWERICAS Rates 62 AGUS 2022 YTO 5/1/2021 GLODAL MKTS ANCRICAS Rates 63 Anual 2022 YTO 671/2021 que GLOBAL MKTS AMERICAS Rates 64 AN 2022 YTD 7712021 GLOBAL MKTS AMERICAS Rates 65 Adual 2022 8712021 CLOBAL MKTS AMERICAS Rates BE Adua 2022 YTD 9/1/2021 GLOBAL MIS AMERICAS Rates 67 Actual 2022 YTD 10/1/2021 GLOBAL MKTS ANERICAS Rates Instructions Global Markets Equity Products Convertibles Equity Derivatives Reedy Accessibility investigate Le - ACCOUNT_L5 ACCOUNT_LE - ACCOUNT_L7 FLOW RATES PE DONUS GUAR DONUS EQUITY DERIVATIVES NPE PROF FEES RECRUITWENT CONVERTIBLES NPE SGA OTHER SGA FLOW RATES NPE PROF FEES RECRUITMENT FLOW RATES NPE TRADE NPE SETTLEMENT FEES FLOW RATES NP PROF FEES MEMBERSHIP FLOW RATES NPS TRADENPE SETTLEMENT FEED FLOW RATES NPE PROF FEES PROF CONSULTING FLOW RATES NPE SGA REGISTRATION EQUITY DERIVATIVES NPE PROF FEES PROF RESEARCH FLOW RATES NPE PROF FEES PROF LEGAL EQUITY DERIVATIVES NPE SGA REGISTRATION EQUITY FINANCE USLB NPE PROF FEES PROF LEGAL EQUITY FINANCE USL6 NPE PROF FEES PROF LEGAL AGENCY MORTGAGES NPE SGA REGISTRATION FLOW RATES NPE PROF FEES PROFLECAL EQUITY FINANCE USLB NPE PROF FEES 3RD PARTY VENDOR MNG AGENCY MORTGAGES NPC 3RD PARTY VENDOR MNG EQUITY FINANCE USL6 NPS SGA REGISTRATION CONVERTIBLES NPE TRADE NPE CLEARING FEES EQUITY FINANCE USL NPE TRADENS SETTLEMENT FFFS AGENCY MORTGACES NPE PROF FEES 3RD PARTY VENDOR MNG EQUITY FINANCE US LB NPC TRADE NPE SETTLEMENT FEES FLOW RATES NPE SGA OTHER CGA CONVERTIBLES NPE SGA REGISTRATION FQUITY DERIVATIVES NPS PROF FEES PROF LEGAL EQUITY DERIVATIVES NP TALES TAXES FLOW RATES NPE SCA OTHER SEA FLOW RATES NPE SGA OTHER SGA FLOW RATES NPE SGA OTHER SGA FLOW RATES NPE PROF FEES CONSULTING AGENCY MORTGAGES NPE BUSINESS DEV TRAVEL EQUITY DERIVATIVES NEE PROF FEES OTHER PROF FEES ACENCY MORTGAGES NPE SGA OTHER SEA EQUITY FINANCE US LB NPE SGA OTHER SGA CONVERTIDLES NPE MARKET DATA NRT MARKET DATA EQUITY DERIVATIVES Nre TAXES TAXES AGENCY MORTGAGES NPE SGA OTHER SGA AGENCY MORTGAGES NPE SCA OTHER DA ACENCY MORTGAGES NPE PROF FEES CONSULTING AGENCY MORTGAGES NPE TRADE NPE OTHER FEES FLOW RATES PC OTHER CD OTHER CO. AGENCY MORTGAGES NPE SGA OTHER SGA FQUITY DERIVATIVES NPE TRADENPE SETTLEMENT FEES EQUITY FINANCE US LE NP- PROF FEES 3RD PARTY VENDOR MNG FLOW RATES NPE COCUPANCY OTHER OCC COSTS EQUITY FINANCE US LS NPE MARKET DATA NRT MARKET DATA FLOW RATES NPS SGA OTHER SGA FLOW RATES NPE TECHNOLOGY NET OTHER AGENCY MORTGAGES NPS SGA MAIL PRINT STAT NPE TECHNOLOGY NET OTHER AGENCY MORTGAGES NPE TRAVEL FLOW RATES NPE TECHNOLOGY NET OTHER CONVERTIDLES NE TRADCNC FUTURES FLOW RATES NPS PROF FEES RECRUITWENT FOUITY DERIVATIVES NPE TRADENPE SETTLEMENT FEES EQUITY DERIVATIVES NEE TRADENPE SETTLEMENT FEES FLOW RATES NPE OCCUPANCY OCC DEPRN FLOW RATES NPC OCCUPANCY OCC DEPRN FLOW RATES NPT OCCUPANCY OCC DCPRN FLOW RATES FLOW RATES NPE OCCUPANCY OCC DEPRN FLOW RATES NPS OCCUPANCY OCC DEPRN FLOW RATES NPE OCCUPANCY OCC DEPRN FLOW RATES NPS OCCUPANCY OCC DEPRN FLOW RATES NPC OCCUPANCY OCC DEPRN Equity Finance Rates Flow Rates Agency Mortgages Data--> Expense Data Revenue Data Sum of MONETARY_AMOUNT (5532,031.4) (5204,000,0) (5136,6927 (5105,000.0) ($90,702.) (501,928.4) (550 756.03 (556,4770) () (541,154,3) ($43,719.1) (535,709.9) (532.100.0) (531,500.0) (523,347 (519,585.9) ($19,570.33 (515,891.9) (58,8571) (59,7717) (58 387.6) (56,800.8) ($6,992.3) (56.220.1) (55,000.5) (55,744.7) (55,434.6) (54,404.9) ($4,403.5) (54,013.2) (54,3302) (53,8178) (53,511.5) (52,901.4) ($3,028.0) (52.995.1) (52,869.77 (52,4601) (52, 108.5) (51,432.9) ($1,112.5) (55112) (5521,3) (52674) (5292.6) ($158.3) $191.0 $221.9 5212.7 51888 52202 SA $20.0 $187.9 $202.7 32180 52-18 1 5219.9 $219.7 $245.1 5223.5 5245.11 $2283 5235.5 $229.3 $242.7 FLOW HATE SS DEY 17 B D E F G H L M N 0 R S T $000s AGENCY MORTGAGES Dec 21 Jan 22 Actual Actual Inc / (Dec) Jan vs. Dec Jan Actual vs. Budget Actuals Inc / (Dec) YTD vs. Budget Jan 22 Jan 22 Budget YTD YTD Jan 22 Budget Actual SALARY BONUS RECRUIT INCENT SEVERANCE OTHER CB Salaries Bonus Recruitment Incentives Severance Other Comp & Benefits Personnel Expenses 8 9 10 11 12 13 14 15 16 17 18 19 20 OCCUPANCY Occupancy TECHNOLOGY Technology MARKET DATA Market Data BUSINESS DEV Business Development 3RD PARTY VENDOR MNG 3rd Party Vendor Mgmt ACCOUNTING&AUDITING Accounting CONSULTING Consulting MEMBERSHIP Membership OTHER PROF FEES Other PROF LEGAL Legal PROF RESEARCH Research RECRUITMENT Recruitment TRAINING Training PROF FEES Professional Fees SGA SGA TAXES Taxes 23 24 27 28 29 30 31 TRADE NPE Non-Trade NPE Trade NPE Non Personnel Expenses Direct Costs 40 41 42 43 44 45 45 47 48 49 50 61 62 53 54 55 ER Instructions Global Markets Equity Products Convertibles Equity Derivatives Equity Finance Rates Flow Rates Agency Mortgages Data--> Expense Data Revenue Data Ready Accessibility Investigate H L N 030 PROFFCES Actbud - Fiscal Year - YTD Future - MONTHLY_PERIOD Division L5 Actus 2022 YTD 12/1/2021 GLOBAL MKTS AMERICAS Rates 4 AM 2022 YTO 9/1/2021 GLOBAL MKTS ANERICAS Equity Products 5 Act 2022 YTO 17112022 GLOBAL MKTS AWFRICAS Equity Products 6 Adual 2022 9/172021 CLOBAL MKTS AMERICAS Rates 7 Actual 2022 YTD 11/1/2021 GLOBAL MKTS AMERICAS Rates B Anual 2022 YTD 5/1/2021 GLOBAL MKTS ANCRICAS Rates 9 AUS 2022 YTD 12/1/2021 GLOBAL MKTS ANERICAS Rates 10 Aal was 2002 971/2001 YTO GLOBAL MKTS AJERICHS Rates cu 11 AQUI 2022 YTO 412021 GLOBAL MKTS AMERICAS HA 12 oua 2022 YTD 9/1/2021 GLOBAL MKTS AMERICAS Equity Products 13 Actual 2022 YTP 5/1/2021 GLOBAL MKTS AMERICAS Rates 14 Acua 2022 YTO 4/1/202 GLOBAL MKTS ANERICAS Equity Products 15 AGUS 2022 47112021 GLOBAL MKTS ANERICAS Equity Products 16 A 2022 YTO 5112021 GLOBAL MKTS ANERICAS Equilty Products 17 AG 2022 YTD 4112001 GLOBAL MKTS AMERICAS Rates 18 Adual 2022 YTD 4/1/2021 CLOBAL MKTS AMERICAS Rates 19 Actual 2022 YTD 10/1/2021 GLOBAL MKTS ANERICAS Equity Products 20 AG 2022 YTD 6/1/2021 GLOBAL MKTS AMERICAS Rates 21 ACUN 2022 YTO 4/1/2021 GLOBAL MKTS ANERICAS Equity Products 22 Anal 2022 YTO 6/1/2021 GLOBAL MKTS ANERICAS Equilty Products 23 Actual 2022 YTD 11/1/2021 GLOBAL MKTS AMERICAS Equny Products 24 Actual 2022 YTD 1/1/2022 CLOBAL MKTS AMERICAS Hates 25 Actual 2022 YTP 12/1/2021 GLOBAL MKTS AWERICAS Equity Products 26 Au 2022 YTO 11/1/2021 GLODAL MKTS ANCRICAS Rates 27 ADUN 2022 YTD 4/1/2021 GLOBAL MKTS AMERICAS Equity Products 28 AUS! 2022 YTO 4112021 GLOBAL MKTS ANERICAS Equity Products 25 Aral 2022 12/1/2021 GLOBAL MKTS AWERICAS Equity Products 30 Actual 2022 YTD 7/1/2021 CLOBAL MKTS AVERICAS Rates 31 Acus 2022 YTD 10/1/2021 GLOBAL MKTS ANERICAS Rates 32 Actual 2022 YTD 1/1/2022 GLOBAL MKTS ANERICAS Rates 33 ADUN 2022 YTO 10/1/2021 GLOBAL MKTS AWERICHS Rates 34 AS 2002 YTD 10/1/2021 GLOBAL MKTS AMERICAS Rates 3 A 2022 YTD 912021 GLOBAL MKTS AMERICAS Equnty Products 20 Aal 2022 YID 1/1/2022 GLOBAL MKTS AMERICAS Rates 37 Anual 2022 YTD 1/1/2022 GLOBAL MKTS ANERICAS Equity Products 30 Actual 2022 2024 YTD 12/1/2021 GLODAL MKTS AMERICAS Equity Products --- 39 Actual 2022 YTD 11/1/2021 GLOBAL MKTS AMERICAS Equity Products 40 AM 2022 YTO 7112021 GLOBAL MKTS AMERICAS Rates 41 Aqua 2022 YTD 10/1/2021 GLOBAL METSAVERICAS Rates 42 Adual 2022 YID 10/1/2021 CLOBAL MKTS AWERICAS Rates 43 Actua 2022 YTD B/1/2021 GLOBAL MKTS AWERICAS Rates 44 Acu 2022 YTO 1/1/2022 GLODAL MKTS ANERICAS Rates 45 ACUS 2022 YTD 11/1/2021 GLOBAL MKTS AMERICAS Rates 46 Antal 2022 YTO 51112021 GLOBAL MKTS AMERICAS Equity Products 47 Adual 2022 YTO 61/2021 CLOBAL MKTS AMERICAS Fauny Products 49 Actual 2022 YTD 6/1/2021 GLOBAL MKTS AMERICAS Rates 49 Actua 2022 YTD 8/1/2021 GLOBAL MKTS ANERICAS Equity Products 50 Acus 2022 YTO 511/2021 GLOBAL MKTS ACRICAS Rates 51 AM 2022 8/1/2021 GLOBAL MKTS AWERICAS Rates 52 Anal 2022 YTO 11/1/2021 GLOBAL MKTS AMERICAS Rates 53 Adual 2022 YTO 6M12021 GLOBAL MKTS AMERICAS Rates N YTD 2022 54 Adua CLOBAL MKIS AMERICAS Hates 5/1/2021 56 Actual 2022 YTD 7/1/2021 GLOBAL MKTS AWERICAS Rates 56 Actual 2022 YTO 6/1/2021 GLOBAL MKTS ANCRICAS Equity Products 57 Acus 2022 YTD 11/1/2021 GLOBAL MKTS AMERICAS Rates 58 AGUS 2022 YTO 97117021 GLOBAL MKTS AMERICAS Equity Products 59 Actual 2022 YTD 812021 GLOBAL MKTS AWERICAS Equity Products BU Actual 2022 YTD 4/1/2021 GLOBAL MKTS AMERICAS Rates 81 Actual 2022 YTD 1/1/2022 GLOBAL MKTS AWERICAS Rates 62 AGUS 2022 YTO 5/1/2021 GLODAL MKTS ANCRICAS Rates 63 Anual 2022 YTO 671/2021 que GLOBAL MKTS AMERICAS Rates 64 AN 2022 YTD 7712021 GLOBAL MKTS AMERICAS Rates 65 Adual 2022 8712021 CLOBAL MKTS AMERICAS Rates BE Adua 2022 YTD 9/1/2021 GLOBAL MIS AMERICAS Rates 67 Actual 2022 YTD 10/1/2021 GLOBAL MKTS ANERICAS Rates Instructions Global Markets Equity Products Convertibles Equity Derivatives Reedy Accessibility investigate Le - ACCOUNT_L5 ACCOUNT_LE - ACCOUNT_L7 FLOW RATES PE DONUS GUAR DONUS EQUITY DERIVATIVES NPE PROF FEES RECRUITWENT CONVERTIBLES NPE SGA OTHER SGA FLOW RATES NPE PROF FEES RECRUITMENT FLOW RATES NPE TRADE NPE SETTLEMENT FEES FLOW RATES NP PROF FEES MEMBERSHIP FLOW RATES NPS TRADENPE SETTLEMENT FEED FLOW RATES NPE PROF FEES PROF CONSULTING FLOW RATES NPE SGA REGISTRATION EQUITY DERIVATIVES NPE PROF FEES PROF RESEARCH FLOW RATES NPE PROF FEES PROF LEGAL EQUITY DERIVATIVES NPE SGA REGISTRATION EQUITY FINANCE USLB NPE PROF FEES PROF LEGAL EQUITY FINANCE USL6 NPE PROF FEES PROF LEGAL AGENCY MORTGAGES NPE SGA REGISTRATION FLOW RATES NPE PROF FEES PROFLECAL EQUITY FINANCE USLB NPE PROF FEES 3RD PARTY VENDOR MNG AGENCY MORTGAGES NPC 3RD PARTY VENDOR MNG EQUITY FINANCE USL6 NPS SGA REGISTRATION CONVERTIBLES NPE TRADE NPE CLEARING FEES EQUITY FINANCE USL NPE TRADENS SETTLEMENT FFFS AGENCY MORTGACES NPE PROF FEES 3RD PARTY VENDOR MNG EQUITY FINANCE US LB NPC TRADE NPE SETTLEMENT FEES FLOW RATES NPE SGA OTHER CGA CONVERTIBLES NPE SGA REGISTRATION FQUITY DERIVATIVES NPS PROF FEES PROF LEGAL EQUITY DERIVATIVES NP TALES TAXES FLOW RATES NPE SCA OTHER SEA FLOW RATES NPE SGA OTHER SGA FLOW RATES NPE SGA OTHER SGA FLOW RATES NPE PROF FEES CONSULTING AGENCY MORTGAGES NPE BUSINESS DEV TRAVEL EQUITY DERIVATIVES NEE PROF FEES OTHER PROF FEES ACENCY MORTGAGES NPE SGA OTHER SEA EQUITY FINANCE US LB NPE SGA OTHER SGA CONVERTIDLES NPE MARKET DATA NRT MARKET DATA EQUITY DERIVATIVES Nre TAXES TAXES AGENCY MORTGAGES NPE SGA OTHER SGA AGENCY MORTGAGES NPE SCA OTHER DA ACENCY MORTGAGES NPE PROF FEES CONSULTING AGENCY MORTGAGES NPE TRADE NPE OTHER FEES FLOW RATES PC OTHER CD OTHER CO. AGENCY MORTGAGES NPE SGA OTHER SGA FQUITY DERIVATIVES NPE TRADENPE SETTLEMENT FEES EQUITY FINANCE US LE NP- PROF FEES 3RD PARTY VENDOR MNG FLOW RATES NPE COCUPANCY OTHER OCC COSTS EQUITY FINANCE US LS NPE MARKET DATA NRT MARKET DATA FLOW RATES NPS SGA OTHER SGA FLOW RATES NPE TECHNOLOGY NET OTHER AGENCY MORTGAGES NPS SGA MAIL PRINT STAT NPE TECHNOLOGY NET OTHER AGENCY MORTGAGES NPE TRAVEL FLOW RATES NPE TECHNOLOGY NET OTHER CONVERTIDLES NE TRADCNC FUTURES FLOW RATES NPS PROF FEES RECRUITWENT FOUITY DERIVATIVES NPE TRADENPE SETTLEMENT FEES EQUITY DERIVATIVES NEE TRADENPE SETTLEMENT FEES FLOW RATES NPE OCCUPANCY OCC DEPRN FLOW RATES NPC OCCUPANCY OCC DEPRN FLOW RATES NPT OCCUPANCY OCC DCPRN FLOW RATES FLOW RATES NPE OCCUPANCY OCC DEPRN FLOW RATES NPS OCCUPANCY OCC DEPRN FLOW RATES NPE OCCUPANCY OCC DEPRN FLOW RATES NPS OCCUPANCY OCC DEPRN FLOW RATES NPC OCCUPANCY OCC DEPRN Equity Finance Rates Flow Rates Agency Mortgages Data--> Expense Data Revenue Data Sum of MONETARY_AMOUNT (5532,031.4) (5204,000,0) (5136,6927 (5105,000.0) ($90,702.) (501,928.4) (550 756.03 (556,4770) () (541,154,3) ($43,719.1) (535,709.9) (532.100.0) (531,500.0) (523,347 (519,585.9) ($19,570.33 (515,891.9) (58,8571) (59,7717) (58 387.6) (56,800.8) ($6,992.3) (56.220.1) (55,000.5) (55,744.7) (55,434.6) (54,404.9) ($4,403.5) (54,013.2) (54,3302) (53,8178) (53,511.5) (52,901.4) ($3,028.0) (52.995.1) (52,869.77 (52,4601) (52, 108.5) (51,432.9) ($1,112.5) (55112) (5521,3) (52674) (5292.6) ($158.3) $191.0 $221.9 5212.7 51888 52202 SA $20.0 $187.9 $202.7 32180 52-18 1 5219.9 $219.7 $245.1 5223.5 5245.11 $2283 5235.5 $229.3 $242.7 FLOW HATE SS DEY A D H 1 Scenario 2 Actual 3 Budget 4 Budget 5 Budget 6 Actual 7 Actual 8 Actual 9 Actual 10 Actual 11 Actual 12 Actual 13 Actual 14 Actual 15 Actual 16 Actual 17 Actual 18 Actual 19 Actual 20 Actual 21 Actual 22 Actual 23 Actual 24 Actual 25 Actual 26 Budget 27 Budget 28 Budget 29 Budget 30 Budget 31 Budget 32 Budget 33 Budget 34 Budget 35 Budget 36 Budget 37 Budget 38 Budget 39 Budget 40 Budget 41 Budget 42 Budget 43 Budget 44 Budget 45 Budget 46 Budget 47 Budget 48 Budget 49 Budget 50 Actual 51 Actual 52 Actual 53 Budget 54 Budget 55 Budget 56 Budget 57 Budget 58 Budget 59 Budget Instructions Ready AccessibilityInvestigate B L5 Equity Products Rates Equity Products Rates Rates Rates Equity Products Equity Products Equity Products Rates Equity Products Rates Equity Products Rates Equity Products Rates Equity Products Equity Products Equity Products Equity Products Rates Equity Products Rates Equity Products Rates Equity Products Rates Equity Products Rates Equity Products Rates Equity Products Rates Equity Products Rates Equity Products Rates Equity Products Rates Equity Products Rates Equity Products Rates Equity Products Rates Equity Products Rates Equity Products Rates Rates Rates Rates Rates Rates Rates Rates Rates Rates Global Markets Equity Products C - Product Equity Derivatives Flow Rates Equity Derivatives Agency Mortgages Flow Rates Agency Mortgages Equity Derivatives Equity Finance Convertibles Flow Rates Equity Derivatives Agency Mortgages Equity Derivatives Agency Mortgages Equity Derivatives Agency Mortgages Equity Derivatives Equity Derivatives Equity Derivatives Equity Derivatives Flow Rates Equity Derivatives Flow Rates Equity Derivatives Flow Rates Equity Derivatives Flow Rates Equity Derivatives Flow Rates Equity Derivatives Flow Rates Equity Derivatives Flow Rates Equity Derivatives Flow Rates Equity Derivatives Flow Rates Equity Derivatives Flow Rates Equity Derivatives Flow Rates Equity Derivatives Flow Rates Equity Derivatives Flow Rates Equity Derivatives Flow Rates Equity Derivatives Flow Rates Agency Mortgages Flow Rates Agency Mortgages Agency Mortgages Agency Mortgages Agency Mortgages Agency Mortgages Agency Mortgages Convertibles Equity Derivatives - Month 2022 YTD 2022 YTD 2022 YTD 2022 YTD 2022 YTD 2022 YTD 2021 Nov 2022 YTD 2022 YTD 2021 Apr 2021 Apr 2021 Apr 2021 May 2021 May 2021 Jun 2021 Jun 2021 Jul 2021 Aug 2021 Sep 2021 Oct 2021 Nov 2021 Dec 2022 Jan 2022 Jan 2021 Apr 2021 Apr 2021 May 2021 May 2021 Jun 2021 Jun 2021 Jul 2021 Jul 2021 Aug 2021 Aug 2021 Sep 2021 Sep 2021 Oct 2021 Oct 2021 Nov 2021 Nov 2021 Dec 2021 Dec 2022 Jan 2022 Jan 2022 Feb 2022 Feb 2022 Mar 2022 Mar 2021 Aug 2021 Sep 2021 Dec 2021 Apr 2021 May 2021 Jun 2021 Jul 2021 Aug 2021 Sep 2021 Oct Equity Finance E Account GBS_AC - Revenue GBS_AC - Revenue GBS AC - Revenue GBS AC - Revenue GBS_AC - Revenue GBS AC - Revenue GBS AC - Revenue GBS AC - Revenue GBS AC - Revenue GBS AC - Revenue GBS_AC - Revenue GBS AC - Revenue GBS AC - Revenue GBS AC - Revenue GBS AC - Revenue GBS AC - Revenue GBS AC - Revenue GBS AC - Revenue GBS AC - Revenue GBS AC - Revenue GBS AC - Revenue GBS AC - Revenue GBS AC - Revenue GBS AC - Revenue GBS AC - Revenue GBS AC - Revenue GBS AC - Revenue GBS AC - Revenue GBS_AC - Revenue GBS_AC - Revenue GBS AC - Revenue GBS AC - Revenue GBS AC - Revenue GBS AC - Revenue GBS AC - Revenue GBS_AC - Revenue GBS AC - Revenue GBS AC - Revenue GBS_AC - Revenue GBS AC - Revenue GBS AC - Revenue GBS AC - Revenue GBS AC - Revenue GBS AC - Revenue GBS_AC - Revenue GBS AC - Revenue GBS AC - Revenue GBS AC - Revenue GBS AC - Revenue GBS AC - Revenue GBS AC - Revenue GBS AC - Revenue GBS_AC - Revenue GBS AC - Revenue GBS AC - Revenue GBS AC - Revenue GBS AC - Revenue GBS AC - Revenue Agency Mortgages G Amount 360,000,000 333,333,333 333,333,333 291,666,667 270.000.000 230,000,000 30 000 000 50.000.000 47,000,000 40 000 000 40,000,000 40,000,000 40,000,000 40.000.000 10,000,000 40 000 000 40,000,000 40.000.000 40,000,000 40,000,000 40,000,000 40,000,000 40,000,000 40.000.000 33,333 333 33,333,333 33,333,333 33,333 333 33,333,333 33,333,333 33,333 333 33 333 333 33,333,333 33,333,333 33 333 333 33,333,333 33,333,333 33,333,333 33,333,333 33,333,333 33,333 333 33,333,333 33,333,333 33,333 333 33,333,333 33,333,333 33,333 333 33,333,333 30,000,000 30,000,000 30,000,000 29.166.667 29, 166,667 29,166.667 29, 166,667 29, 166,667 29, 166 667 29.166.667 Data--> Expense Data Agency Mortgage Rates Flow Rates Revenue Data # This case study represents a standard monthly expense report the team puts together after the month- end close. It summarizes monthly expenses and highlights variances compared to the prior month and the budget for individual products and divisions of overall Americas for an international bank, and is sent to senior management with commentary. This case is designed to test your ability to use different formulas and functionalities in Excel to summarize data into a presentable format for senior management and to be able to effectively present the data visually. You are not expected to spend more than 2 hours on this exercise. You will be required to take the expense data in the corresponding excel file and set up expense management views for the two products under Global Markets (Equity Products and Rates). For context, the chart below shows how the Global Markets business is organized. You will see that the data is extracted from the system in a similar way in columns E and F of the expense data tab. a Global Markets Rates Equity Products Flow Rates Agency Mortgages Structured Rates Convertibles Equity Derivatives Equity Finance Required Tasks: Excel Analysis/Data Aggregation: 0 Utilize any excel formulas you see fit to extract and aggregate the data from the expense data tab in the excel file into the 4 equity products tabs. The "Equity Products tab should total to the sum of Convertibles, Equity Derivatives, and Equity Finance. Column B has been prepopulated to match the account name in the expense data tab. o The Rates tabs have already been populated and can be used for reference. Please note only Professional Fees require a breakdown by subaccount/Account L7. The other Level 6 accounts do not need to show the subaccount breakdown. Update the formatting of the Equity Products tabs to be uniform to the Rates tab. Font: Arial size 10 Sub-totals and totals for Direct Costs, Other Direct Costs, Non Personnel Expenses, and Personnel Expenses should be bolded and highlighted in grey All amounts should be represented in $000s After completing each of the Equity Products tabs, again utilize any excel formulas or functionalities necessary to complete the Global Markets data which should total to the sum of Equity Products and Rates. O o O E M Q R. 1000 Sooos Equity Products Inc / Dec Jan vs. Des Jan Actual vs. Actuals Budget Dec 21 Actual Inc/ (Dec Jan 22 Budget YTD vs. Budget YTD Jan 22 Actual Jan 22 Actual YTD Jan 22 Budget Salaries SALARY BONUS RECRUIT INCENT SEVERANCE OTHER CB Bonus Recruitment Incentives Severance Other Comp & Benefits Personnel Expenses 6 7 8 9 10 11 12 13 14 15 16 17 18 19 20 21 22 23 24 25 26 27 28 29 30 31 32 33 34 OCCUPANCY TECHNOLOGY MARKET DATA BUSINESS DEV 3RD PARTY VENDOR MNG ACCOUNTING S.AUDITING CONSULTING MEMBERSHIP OTHER PROF FEES PROF LEGAL PROF RESEARCH RECRUITMENT TRAINING PROF FEES SGA TAXES Occupancy Technology Market Data Business Development 3rd Party Vendor Mgmt. Accounting Consulting Membership Other Legal Research Recruitment Training Professional Fees SGA Taxes TRADE NPE Non-Trade NPE Trade NPE Non Personnel Expenses Direct Costs 36 37 38 39 40 41 42 43 44 45 46 47 48 49 50 51 52 53 54 55 66 Equity Products Convertibles Equity Derivatives Equity Finance Rates Flow Rates Agency Mortgages Data--> Expense Data Revenue Data Instructions Global Markets Accessibility: Investigate Ready B C D E F G H AL M N O Q R S S - 1000 sooos Convertibles Inc/ (Dec Jan vs. Dec Jan Actual vs. Actuals Budget Dec 21 Actual Inc/ (Dec) YTD VS. Budget Jan 22 Actual Jan 22 Actual YTD Jan 22 Bac Pet Jan 22 Budget YTD SALARY BONUS RECRUIT INCENT SEVERANCE OTHER CB Salaries Bonus Recruitment Incentives Severance Other Comp & Benefits Personnel Expenses 7 8 9 10 11 12 13 14 15 16 17 18 19 20 21 22 23 24 25 26 27 28 29 30 31 32 33 34 OCCUPANCY TECHNOLOGY MARKET DATA BUSINESS DEV 3RD PARTY VENDOR MNG ACCOUNTING & AUDITING CONSULTING MEMBERSHIP OTHER PROF FEES PROF LEGAL PROF RESEARCH RECRUITMENT TRAINING PROF FEES SGA TAXES Occupancy Technoloey Market Data Business Development 3rd Party Vendor Mgmt. Accounting Consulting Membership Other Legal Research Recruitment Training Professional Fees SGA Taxes Non-Trade NPE Trade NPE TRADE NPE Non Personnel Expenses Direct Costs 36 37 38 39 40 41 42 43 45 46 47 48 49 50 51 52 53 54 55 Instructions Global Markets Equity Products Convertibles Equity Derivatives Equity Finance Rates Flow Rates Agency Mortgages Data- Expense Data Revenue Data + Pour Torrorribiliter Inunttiauto B F DE G H K M NT 0 P P 0 R 1000 5000s EQUITY DERIVATIVES Inc/(Dec) Dec 21 Actual Jan 22 Actual Jan 22 Budget YTD YTD vs. Budget SALARY BONUS RECRUIT INCENT SEVERANCE OTHER CB Salaries Bonus Recruitment Incentives Severance Other Comp & Benefits Personnel Expenses Inc. (Dach Jan 22 Jan vs. Dec Jan Actual Jan 22 Actual Budget Actuals vs. Budget YTD S0.00 $0.00 50.00 30.00 S0.00 $0.00 50.00 $0.00 S0.00 $0.00 $0.00 50.00 6 7 8 9 10 11 12 13 14 15 16 17 18 19 20 21 22 23 24. 25 26 27 28 29 30 31 32 33 34. OCCUPANCY Occupancy TECHNOLOGY Technology MARKET DATA Market Data BUSINESS DEV Business Development 3RD PARTY VENDOR MNG 3rd Party Vendor Mgmt. ACCOUNTING&AUDITING Accounting CONSULTING Consulting MEMBERSHIP Membership OTHER PROF FEES Other PROF LEGAL Lega PROF RESEARCH Research RECRUITMENT Recruitment TRAINING Training PROF FEES Professional Fees SGA SGA TAXES Taxes $0.00 50.00 SO 00 $0.00 S0.00 $0.00 $0.00 SO 00 50.00 S0.00 50.00 $0.00 S0.00 50.00 S0.00 50.00 $0.00 30.00 $0.00 $0.00 $0.00 $0.00 50.00 $0.00 $0.00 $0.00 $0.00 $0.00 $0.00 $0.00 $0.00 50.00 Non-Trade NPE Trade NPE 50.00 S0.00 $0.00 $0.00 TRADE NPE 50 00 50 00 Non Personnel Expenses Direct Costs $0.00 $0.00 35 37 38 39 40 41 42 43 44 45 46 47 48 49 50 51 52 53 54 55 56 57 Instructions Global Markets Equity Products Convertibles Equity Derivatives Equity Finance Rates Flow Rates Agency Mortgages Data--> Expense Data Revenue Data # ALI ilumina B D E G J K L M N 0 R ST 1000 $ 000 EQUITY FINANCE USL6 Dec 21 Actual Jan 22 Actual Inc / (Dec) Jan 22 Jan vs. Dec Jan Actual Budget Actuals vs. Budget Jan 22 Actual YTD Jan 22 Budget YTD Inc / Dec) YTD vs. Budget SALARY BONUS RECRUIT INCENT SEVERANCE OTHER CE Salaries Bonus Recruitment Incentives Severance Other Comp & Benefits Personnel Expenses S - $ . S . $. S. $ . S. $. 9 10 11 12 13 14 15 16 17 18 19 20 21 22 23 24 25 26 27 28 29 30 31 32 33 34 OCCUPANCY Occupancy TECHNOLOGY Technology MARKET DATA Market Data BUSINESS DEV Business Development 3RD PARTY VENDOR MNG 3rd Party Vendor Mgmt. ACCOUNTING&AUDITING Accounting CONSULTING Consulting MEMBERSHIP Membership OTHER PROF FEES Other PROF LEGAL Legal PROF RESEARCH Research RECRUITMENT Recruitment TRAINING Training PROF FEES Professional Fees SGA SGA TAXES Taxes TRADE NPE Non-Trade NPE Trade NPE 0.00 0.00 0.00 0.00 Non Personnel Expenses Direct Costs 0.00 0.00 0.00 0.00 0.00 0.00 0.00 0.00 0.00 0.00 0.00 0.00 36 37 38 39 40 41 42 43 44 45 46 47 48 Instructions Global Markets Equity Products Convertibles Equity Derivatives Equity Finance Rates Flow Rates Agency Mortgages Data--> Expense Data Revenue Data Rear the Arressibility Investimate 12 B F H NO Q R U VW $000s Rates Inc Dec) Jan Vs. Jan Actual Dec 21 Jan 22 Jan 22 Dec Actual vs. Budget Actual Budget Actuals Jan 22 Jan 22 Actual Budget YTD YTD Inc/(Dec YTD VS. Budget SALARY BONUS RECRUIT INCENT SEVERANCE OTHER CB 10 11 12 13 14 15 16 17 Salaries Bonus Recruitment Incentives Severance Other Comp & Benefits Personnel Expenses Occupancy Technology Market Data Business Development 3rd Party Vendor Mgmt Accounting Consulting Membership Other Legal Research Recruitment Training Professional Fees SGA Taxes OCCUPANCY TECHNOLOGY MARKET DATA BUSINESS DEV 3RD PARTY VENOOR MNG ACCOUNTING&AUDITING CONSULTING WEMBERSHP OTHER PROF FEES PROF LEGAL PROF RESEARCH RECRUITMENT TRAINING PROF FEES SGA TAXES 19 TRADE NPE Non-Trade NPL Trade NPE Non Personnel Expenses Direct Costs 47 48 49 50 51 52 53 54 57 61 63 64 65 66 67 68 Instructions Global Markets Equity Products Convertibles Equity Derivatives Equity Finance Rates Flow Rates Agency Mortgages Data--> Expense Data Revenue Data + Ready Accessibility Investigate D N 0 R S **Figures shown here can be used to compare your work once you over ride with formulas SOODS FLOW RATES Inc / (Dec) YTD VS. Dec 21 Jan 22 Actual Actual 1.566 1,649 3.945 3,811 36 117 Inc / (Dec) Jan 22 Jan vs. Dec Jan Actual Actuals Budget vs. Budget 1.875 83 (226) 4,583 (135) (773) 25 81 92 Jan 22 Actual YTD 16.626 43,482 151 Jan 22 Budget YTD 18,750 45.833 250 Budget (2.124) SALARY BONUS RECRUIT INCENT SEVERANCE OTHER CB (99) Salanes Bonus Recruitment Incentives Severance Other Comp & Benefits Personnel Expenses 303 5,851 444 6,021 375 6,858 141 170 69 4,687 3.750 (837) 54,94568,583 12 13 (3,638) 15 16 17 18 19 90 113 459 65 92 83 398 103 1 84 130 450 110 0 2 (30) 1601 18 1 9 (46) 1521 (6) 1 900 1.274 4.577 604 2 2 4 116 7 838 1.296 4.500 1,097 2 a $8.5E sk****, 5.85333 8 8 12 6 6 1 1 (8) 8) (3) (6) 8 8 OCCUPANCY Occupancy TECHNOLOGY Technology MARKET DATA Market Data BUSINESS DEV Business Development 3RD PARTY VENDOR MING 3rd Party Vendor Mgmt ACCOUNTINGRAUDITING Accounting CONSULTING Consulting MEMBERSHIP Membership OTHER PROF FEES Other PROF LEGAL Legal PROF RESEARCH Research RECRUITMENT Recruitment TRAINING Training PROF FEES Professional Fees SGA SGA TAXES Taxes 58 8 9 3 29 68 42 322 292 71 - - - 22 60 39 81 34 10 25 1 62 42 58 58 (26) (29) (25) (1) 19 (8) (48) 280 5 737 475 354 250 8 618 417 583 Non-Trade NPE Trade NPE 36a 5,357 802 6,006 935 4.900 (66) 648 (133) 1,106 9.119 54,732 9,348 49,000 TRADE NPE 682 Non Personnel Expenses Direct Costs 6,225 6,807 5,835 12,076 12,828 12,693 973 63,901 58,348 135 128,847 126,932 5,553 1,915 752 40 41 42 43 44 45 46 47 48 49 54 55 Instructions Global Markets Equity Products Convertibles Equity Derivatives Equity Finance Rates Flow Rates Agency Mortgages Data-> Expense Data Revenue Data Padu 9. decerril e Imuniste H L N 030 PROFFCES Actbud - Fiscal Year - YTD Future - MONTHLY_PERIOD Division L5 Actus 2022 YTD 12/1/2021 GLOBAL MKTS AMERICAS Rates 4 AM 2022 YTO 9/1/2021 GLOBAL MKTS ANERICAS Equity Products 5 Act 2022 YTO 17112022 GLOBAL MKTS AWFRICAS Equity Products 6 Adual 2022 9/172021 CLOBAL MKTS AMERICAS Rates 7 Actual 2022 YTD 11/1/2021 GLOBAL MKTS AMERICAS Rates B Anual 2022 YTD 5/1/2021 GLOBAL MKTS ANCRICAS Rates 9 AUS 2022 YTD 12/1/2021 GLOBAL MKTS ANERICAS Rates 10 Aal was 2002 971/2001 YTO GLOBAL MKTS AJERICHS Rates cu 11 AQUI 2022 YTO 412021 GLOBAL MKTS AMERICAS HA 12 oua 2022 YTD 9/1/2021 GLOBAL MKTS AMERICAS Equity Products 13 Actual 2022 YTP 5/1/2021 GLOBAL MKTS AMERICAS Rates 14 Acua 2022 YTO 4/1/202 GLOBAL MKTS ANERICAS Equity Products 15 AGUS 2022 47112021 GLOBAL MKTS ANERICAS Equity Products 16 A 2022 YTO 5112021 GLOBAL MKTS ANERICAS Equilty Products 17 AG 2022 YTD 4112001 GLOBAL MKTS AMERICAS Rates 18 Adual 2022 YTD 4/1/2021 CLOBAL MKTS AMERICAS Rates 19 Actual 2022 YTD 10/1/2021 GLOBAL MKTS ANERICAS Equity Products 20 AG 2022 YTD 6/1/2021 GLOBAL MKTS AMERICAS Rates 21 ACUN 2022 YTO 4/1/2021 GLOBAL MKTS ANERICAS Equity Products 22 Anal 2022 YTO 6/1/2021 GLOBAL MKTS ANERICAS Equilty Products 23 Actual 2022 YTD 11/1/2021 GLOBAL MKTS AMERICAS Equny Products 24 Actual 2022 YTD 1/1/2022 CLOBAL MKTS AMERICAS Hates 25 Actual 2022 YTP 12/1/2021 GLOBAL MKTS AWERICAS Equity Products 26 Au 2022 YTO 11/1/2021 GLODAL MKTS ANCRICAS Rates 27 ADUN 2022 YTD 4/1/2021 GLOBAL MKTS AMERICAS Equity Products 28 AUS! 2022 YTO 4112021 GLOBAL MKTS ANERICAS Equity Products 25 Aral 2022 12/1/2021 GLOBAL MKTS AWERICAS Equity Products 30 Actual 2022 YTD 7/1/2021 CLOBAL MKTS AVERICAS Rates 31 Acus 2022 YTD 10/1/2021 GLOBAL MKTS ANERICAS Rates 32 Actual 2022 YTD 1/1/2022 GLOBAL MKTS ANERICAS Rates 33 ADUN 2022 YTO 10/1/2021 GLOBAL MKTS AWERICHS Rates 34 AS 2002 YTD 10/1/2021 GLOBAL MKTS AMERICAS Rates 3 A 2022 YTD 912021 GLOBAL MKTS AMERICAS Equnty Products 20 Aal 2022 YID 1/1/2022 GLOBAL MKTS AMERICAS Rates 37 Anual 2022 YTD 1/1/2022 GLOBAL MKTS ANERICAS Equity Products 30 Actual 2022 2024 YTD 12/1/2021 GLODAL MKTS AMERICAS Equity Products --- 39 Actual 2022 YTD 11/1/2021 GLOBAL MKTS AMERICAS Equity Products 40 AM 2022 YTO 7112021 GLOBAL MKTS AMERICAS Rates 41 Aqua 2022 YTD 10/1/2021 GLOBAL METSAVERICAS Rates 42 Adual 2022 YID 10/1/2021 CLOBAL MKTS AWERICAS Rates 43 Actua 2022 YTD B/1/2021 GLOBAL MKTS AWERICAS Rates 44 Acu 2022 YTO 1/1/2022 GLODAL MKTS ANERICAS Rates 45 ACUS 2022 YTD 11/1/2021 GLOBAL MKTS AMERICAS Rates 46 Antal 2022 YTO 51112021 GLOBAL MKTS AMERICAS Equity Products 47 Adual 2022 YTO 61/2021 CLOBAL MKTS AMERICAS Fauny Products 49 Actual 2022 YTD 6/1/2021 GLOBAL MKTS AMERICAS Rates 49 Actua 2022 YTD 8/1/2021 GLOBAL MKTS ANERICAS Equity Products 50 Acus 2022 YTO 511/2021 GLOBAL MKTS ACRICAS Rates 51 AM 2022 8/1/2021 GLOBAL MKTS AWERICAS Rates 52 Anal 2022 YTO 11/1/2021 GLOBAL MKTS AMERICAS Rates 53 Adual 2022 YTO 6M12021 GLOBAL MKTS AMERICAS Rates N YTD 2022 54 Adua CLOBAL MKIS AMERICAS Hates 5/1/2021 56 Actual 2022 YTD 7/1/2021 GLOBAL MKTS AWERICAS Rates 56 Actual 2022 YTO 6/1/2021 GLOBAL MKTS ANCRICAS Equity Products 57 Acus 2022 YTD 11/1/2021 GLOBAL MKTS AMERICAS Rates 58 AGUS 2022 YTO 97117021 GLOBAL MKTS AMERICAS Equity Products 59 Actual 2022 YTD 812021 GLOBAL MKTS AWERICAS Equity Products BU Actual 2022 YTD 4/1/2021 GLOBAL MKTS AMERICAS Rates 81 Actual 2022 YTD 1/1/2022 GLOBAL MKTS AWERICAS Rates 62 AGUS 2022 YTO 5/1/2021 GLODAL MKTS ANCRICAS Rates 63 Anual 2022 YTO 671/2021 que GLOBAL MKTS AMERICAS Rates 64 AN 2022 YTD 7712021 GLOBAL MKTS AMERICAS Rates 65 Adual 2022 8712021 CLOBAL MKTS AMERICAS Rates BE Adua 2022 YTD 9/1/2021 GLOBAL MIS AMERICAS Rates 67 Actual 2022 YTD 10/1/2021 GLOBAL MKTS ANERICAS Rates Instructions Global Markets Equity Products Convertibles Equity Derivatives Reedy Accessibility investigate Le - ACCOUNT_L5 ACCOUNT_LE - ACCOUNT_L7 FLOW RATES PE DONUS GUAR DONUS EQUITY DERIVATIVES NPE PROF FEES RECRUITWENT CONVERTIBLES NPE SGA OTHER SGA FLOW RATES NPE PROF FEES RECRUITMENT FLOW RATES NPE TRADE NPE SETTLEMENT FEES FLOW RATES NP PROF FEES MEMBERSHIP FLOW RATES NPS TRADENPE SETTLEMENT FEED FLOW RATES NPE PROF FEES PROF CONSULTING FLOW RATES NPE SGA REGISTRATION EQUITY DERIVATIVES NPE PROF FEES PROF RESEARCH FLOW RATES NPE PROF FEES PROF LEGAL EQUITY DERIVATIVES NPE SGA REGISTRATION EQUITY FINANCE USLB NPE PROF FEES PROF LEGAL EQUITY FINANCE USL6 NPE PROF FEES PROF LEGAL AGENCY MORTGAGES NPE SGA REGISTRATION FLOW RATES NPE PROF FEES PROFLECAL EQUITY FINANCE USLB NPE PROF FEES 3RD PARTY VENDOR MNG AGENCY MORTGAGES NPC 3RD PARTY VENDOR MNG EQUITY FINANCE USL6 NPS SGA REGISTRATION CONVERTIBLES NPE TRADE NPE CLEARING FEES EQUITY FINANCE USL NPE TRADENS SETTLEMENT FFFS AGENCY MORTGACES NPE PROF FEES 3RD PARTY VENDOR MNG EQUITY FINANCE US LB NPC TRADE NPE SETTLEMENT FEES FLOW RATES NPE SGA OTHER CGA CONVERTIBLES NPE SGA REGISTRATION FQUITY DERIVATIVES NPS PROF FEES PROF LEGAL EQUITY DERIVATIVES NP TALES TAXES FLOW RATES NPE SCA OTHER SEA FLOW RATES NPE SGA OTHER SGA FLOW RATES NPE SGA OTHER SGA FLOW RATES NPE PROF FEES CONSULTING AGENCY MORTGAGES NPE BUSINESS DEV TRAVEL EQUITY DERIVATIVES NEE PROF FEES OTHER PROF FEES ACENCY MORTGAGES NPE SGA OTHER SEA EQUITY FINANCE US LB NPE SGA OTHER SGA CONVERTIDLES NPE MARKET DATA NRT MARKET DATA EQUITY DERIVATIVES Nre TAXES TAXES AGENCY MORTGAGES NPE SGA OTHER SGA AGENCY MORTGAGES NPE SCA OTHER DA ACENCY MORTGAGES NPE PROF FEES CONSULTING AGENCY MORTGAGES NPE TRADE NPE OTHER FEES FLOW RATES PC OTHER CD OTHER CO. AGENCY MORTGAGES NPE SGA OTHER SGA FQUITY DERIVATIVES NPE TRADENPE SETTLEMENT FEES EQUITY FINANCE US LE NP- PROF FEES 3RD PARTY VENDOR MNG FLOW RATES NPE COCUPANCY OTHER OCC COSTS EQUITY FINANCE US LS NPE MARKET DATA NRT MARKET DATA FLOW RATES NPS SGA OTHER SGA FLOW RATES NPE TECHNOLOGY NET OTHER AGENCY MORTGAGES NPS SGA MAIL PRINT STAT NPE TECHNOLOGY NET OTHER AGENCY MORTGAGES NPE TRAVEL FLOW RATES NPE TECHNOLOGY NET OTHER CONVERTIDLES NE TRADCNC FUTURES FLOW RATES NPS PROF FEES RECRUITWENT FOUITY DERIVATIVES NPE TRADENPE SETTLEMENT FEES EQUITY DERIVATIVES NEE TRADENPE SETTLEMENT FEES FLOW RATES NPE OCCUPANCY OCC DEPRN FLOW RATES NPC OCCUPANCY OCC DEPRN FLOW RATES NPT OCCUPANCY OCC DCPRN FLOW RATES FLOW RATES NPE OCCUPANCY OCC DEPRN FLOW RATES NPS OCCUPANCY OCC DEPRN FLOW RATES NPE OCCUPANCY OCC DEPRN FLOW RATES NPS OCCUPANCY OCC DEPRN FLOW RATES NPC OCCUPANCY OCC DEPRN Equity Finance Rates Flow Rates Agency Mortgages Data--> Expense Data Revenue Data Sum of MONETARY_AMOUNT (5532,031.4) (5204,000,0) (5136,6927 (5105,000.0) ($90,702.) (501,928.4) (550 756.03 (556,4770) () (541,154,3) ($43,719.1) (535,709.9) (532.100.0) (531,500.0) (523,347 (519,585.9) ($19,570.33 (515,891.9) (58,8571) (59,7717) (58 387.6) (56,800.8) ($6,992.3) (56.220.1) (55,000.5) (55,744.7) (55,434.6) (54,404.9) ($4,403.5) (54,013.2) (54,3302) (53,8178) (53,511.5) (52,901.4) ($3,028.0) (52.995.1) (52,869.77 (52,4601) (52, 108.5) (51,432.9) ($1,112.5) (55112) (5521,3) (52674) (5292.6) ($158.3) $191.0 $221.9 5212.7 51888 52202 SA $20.0 $187.9 $202.7 32180 52-18 1 5219.9 $219.7 $245.1 5223.5 5245.11 $2283 5235.5 $229.3 $242.7 FLOW HATE SS DEY 17 B D E F G H L M N 0 R S T $000s AGENCY MORTGAGES Dec 21 Jan 22 Actual Actual Inc / (Dec) Jan vs. Dec Jan Actual vs. Budget Actuals Inc / (Dec) YTD vs. Budget Jan 22 Jan 22 Budget YTD YTD Jan 22 Budget Actual SALARY BONUS RECRUIT INCENT SEVERANCE OTHER CB Salaries Bonus Recruitment Incentives Severance Other Comp & Benefits Personnel Expenses 8 9 10 11 12 13 14 15 16 17 18 19 20 OCCUPANCY Occupancy TECHNOLOGY Technology MARKET DATA Market Data BUSINESS DEV Business Development 3RD PARTY VENDOR MNG 3rd Party Vendor Mgmt ACCOUNTING&AUDITING Accounting CONSULTING Consulting MEMBERSHIP Membership OTHER PROF FEES Other PROF LEGAL Legal PROF RESEARCH Research RECRUITMENT Recruitment TRAINING Training PROF FEES Professional Fees SGA SGA TAXES Taxes 23 24 27 28 29 30 31 TRADE NPE Non-Trade NPE Trade NPE Non Personnel Expenses Direct Costs 40 41 42 43 44 45 45 47 48 49 50 61 62 53 54 55 ER Instructions Global Markets Equity Products Convertibles Equity Derivatives Equity Finance Rates Flow Rates Agency Mortgages Data--> Expense Data Revenue Data Ready Accessibility Investigate H L N 030 PROFFCES Actbud - Fiscal Year - YTD Future - MONTHLY_PERIOD Division L5 Actus 2022 YTD 12/1/2021 GLOBAL MKTS AMERICAS Rates 4 AM 2022 YTO 9/1/2021 GLOBAL MKTS ANERICAS Equity Products 5 Act 2022 YTO 17112022 GLOBAL MKTS AWFRICAS Equity Products 6 Adual 2022 9/172021 CLOBAL MKTS AMERICAS Rates 7 Actual 2022 YTD 11/1/2021 GLOBAL MKTS AMERICAS Rates B Anual 2022 YTD 5/1/2021 GLOBAL MKTS ANCRICAS Rates 9 AUS 2022 YTD 12/1/2021 GLOBAL MKTS ANERICAS Rates 10 Aal was 2002 971/2001 YTO GLOBAL MKTS AJERICHS Rates cu 11 AQUI 2022 YTO 412021 GLOBAL MKTS AMERICAS HA 12 oua 2022 YTD 9/1/2021 GLOBAL MKTS AMERICAS Equity Products 13 Actual 2022 YTP 5/1/2021 GLOBAL MKTS AMERICAS Rates 14 Acua 2022 YTO 4/1/202 GLOBAL MKTS ANERICAS Equity Products 15 AGUS 2022 47112021 GLOBAL MKTS ANERICAS Equity Products 16 A 2022 YTO 5112021 GLOBAL MKTS ANERICAS Equilty Products 17 AG 2022 YTD 4112001 GLOBAL MKTS AMERICAS Rates 18 Adual 2022 YTD 4/1/2021 CLOBAL MKTS AMERICAS Rates 19 Actual 2022 YTD 10/1/2021 GLOBAL MKTS ANERICAS Equity Products 20 AG 2022 YTD 6/1/2021 GLOBAL MKTS AMERICAS Rates 21 ACUN 2022 YTO 4/1/2021 GLOBAL MKTS ANERICAS Equity Products 22 Anal 2022 YTO 6/1/2021 GLOBAL MKTS ANERICAS Equilty Products 23 Actual 2022 YTD 11/1/2021 GLOBAL MKTS AMERICAS Equny Products 24 Actual 2022 YTD 1/1/2022 CLOBAL MKTS AMERICAS Hates 25 Actual 2022 YTP 12/1/2021 GLOBAL MKTS AWERICAS Equity Products 26 Au 2022 YTO 11/1/2021 GLODAL MKTS ANCRICAS Rates 27 ADUN 2022 YTD 4/1/2021 GLOBAL MKTS AMERICAS Equity Products 28 AUS! 2022 YTO 4112021 GLOBAL MKTS ANERICAS Equity Products 25 Aral 2022 12/1/2021 GLOBAL MKTS AWERICAS Equity Products 30 Actual 2022 YTD 7/1/2021 CLOBAL MKTS AVERICAS Rates 31 Acus 2022 YTD 10/1/2021 GLOBAL MKTS ANERICAS Rates 32 Actual 2022 YTD 1/1/2022 GLOBAL MKTS ANERICAS Rates 33 ADUN 2022 YTO 10/1/2021 GLOBAL MKTS AWERICHS Rates 34 AS 2002 YTD 10/1/2021 GLOBAL MKTS AMERICAS Rates 3 A 2022 YTD 912021 GLOBAL MKTS AMERICAS Equnty Products 20 Aal 2022 YID 1/1/2022 GLOBAL MKTS AMERICAS Rates 37 Anual 2022 YTD 1/1/2022 GLOBAL MKTS ANERICAS Equity Products 30 Actual 2022 2024 YTD 12/1/2021 GLODAL MKTS AMERICAS Equity Products --- 39 Actual 2022 YTD 11/1/2021 GLOBAL MKTS AMERICAS Equity Products 40 AM 2022 YTO 7112021 GLOBAL MKTS AMERICAS Rates 41 Aqua 2022 YTD 10/1/2021 GLOBAL METSAVERICAS Rates 42 Adual 2022 YID 10/1/2021 CLOBAL MKTS AWERICAS Rates 43 Actua 2022 YTD B/1/2021 GLOBAL MKTS AWERICAS Rates 44 Acu 2022 YTO 1/1/2022 GLODAL MKTS ANERICAS Rates 45 ACUS 2022 YTD 11/1/2021 GLOBAL MKTS AMERICAS Rates 46 Antal 2022 YTO 51112021 GLOBAL MKTS AMERICAS Equity Products 47 Adual 2022 YTO 61/2021 CLOBAL MKTS AMERICAS Fauny Products 49 Actual 2022 YTD 6/1/2021 GLOBAL MKTS AMERICAS Rates 49 Actua 2022 YTD 8/1/2021 GLOBAL MKTS ANERICAS Equity Products 50 Acus 2022 YTO 511/2021 GLOBAL MKTS ACRICAS Rates 51 AM 2022 8/1/2021 GLOBAL MKTS AWERICAS Rates 52 Anal 2022 YTO 11/1/2021 GLOBAL MKTS AMERICAS Rates 53 Adual 2022 YTO 6M12021 GLOBAL MKTS AMERICAS Rates N YTD 2022 54 Adua CLOBAL MKIS AMERICAS Hates 5/1/2021 56 Actual 2022 YTD 7/1/2021 GLOBAL MKTS AWERICAS Rates 56 Actual 2022 YTO 6/1/2021 GLOBAL MKTS ANCRICAS Equity Products 57 Acus 2022 YTD 11/1/2021 GLOBAL MKTS AMERICAS Rates 58 AGUS 2022 YTO 97117021 GLOBAL MKTS AMERICAS Equity Products 59 Actual 2022 YTD 812021 GLOBAL MKTS AWERICAS Equity Products BU Actual 2022 YTD 4/1/2021 GLOBAL MKTS AMERICAS Rates 81 Actual 2022 YTD 1/1/2022 GLOBAL MKTS AWERICAS Rates 62 AGUS 2022 YTO 5/1/2021 GLODAL MKTS ANCRICAS Rates 63 Anual 2022 YTO 671/2021 que GLOBAL MKTS AMERICAS Rates 64 AN 2022 YTD 7712021 GLOBAL MKTS AMERICAS Rates 65 Adual 2022 8712021 CLOBAL MKTS AMERICAS Rates BE Adua 2022 YTD 9/1/2021 GLOBAL MIS AMERICAS Rates 67 Actual 2022 YTD 10/1/2021 GLOBAL MKTS ANERICAS Rates Instructions Global Markets Equity Products Convertibles Equity Derivatives Reedy Accessibility investigate Le - ACCOUNT_L5 ACCOUNT_LE - ACCOUNT_L7 FLOW RATES PE DONUS GUAR DONUS EQUITY DERIVATIVES NPE PROF FEES RECRUITWENT CONVERTIBLES NPE SGA OTHER SGA FLOW RATES NPE PROF FEES RECRUITMENT FLOW RATES NPE TRADE NPE SETTLEMENT FEES FLOW RATES NP PROF FEES MEMBERSHIP FLOW RATES NPS TRADENPE SETTLEMENT FEED FLOW RATES NPE PROF FEES PROF CONSULTING FLOW RATES NPE SGA REGISTRATION EQUITY DERIVATIVES NPE PROF FEES PROF RESEARCH FLOW RATES NPE PROF FEES PROF LEGAL EQUITY DERIVATIVES NPE SGA REGISTRATION EQUITY FINANCE USLB NPE PROF FEES PROF LEGAL EQUITY FINANCE USL6 NPE PROF FEES PROF LEGAL AGENCY MORTGAGES NPE SGA REGISTRATION FLOW RATES NPE PROF FEES PROFLECAL EQUITY FINANCE USLB NPE PROF FEES 3RD PARTY VENDOR MNG AGENCY MORTGAGES NPC 3RD PARTY VENDOR MNG EQUITY FINANCE USL6 NPS SGA REGISTRATION CONVERTIBLES NPE TRADE NPE CLEARING FEES EQUITY FINANCE USL NPE TRADENS SETTLEMENT FFFS AGENCY MORTGACES NPE PROF FEES 3RD PARTY VENDOR MNG EQUITY FINANCE US LB NPC TRADE NPE SETTLEMENT FEES FLOW RATES NPE SGA OTHER CGA CONVERTIBLES NPE SGA REGISTRATION FQUITY DERIVATIVES NPS PROF FEES PROF LEGAL EQUITY DERIVATIVES NP TALES TAXES FLOW RATES NPE SCA OTHER SEA FLOW RATES NPE SGA OTHER SGA FLOW RATES NPE SGA OTHER SGA FLOW RATES NPE PROF FEES CONSULTING AGENCY MORTGAGES NPE BUSINESS DEV TRAVEL EQUITY DERIVATIVES NEE PROF FEES OTHER PROF FEES ACENCY MORTGAGES NPE SGA OTHER SEA EQUITY FINANCE US LB NPE SGA OTHER SGA CONVERTIDLES NPE MARKET DATA NRT MARKET DATA EQUITY DERIVATIVES Nre TAXES TAXES AGENCY MORTGAGES NPE SGA OTHER SGA AGENCY MORTGAGES NPE SCA OTHER DA ACENCY MORTGAGES NPE PROF FEES CONSULTING AGENCY MORTGAGES NPE TRADE NPE OTHER FEES FLOW RATES PC OTHER CD OTHER CO. AGENCY MORTGAGES NPE SGA OTHER SGA FQUITY DERIVATIVES NPE TRADENPE SETTLEMENT FEES EQUITY FINANCE US LE NP- PROF FEES 3RD PARTY VENDOR MNG FLOW RATES NPE COCUPANCY OTHER OCC COSTS EQUITY FINANCE US LS NPE MARKET DATA NRT MARKET DATA FLOW RATES NPS SGA OTHER SGA FLOW RATES NPE TECHNOLOGY NET OTHER AGENCY MORTGAGES NPS SGA MAIL PRINT STAT NPE TECHNOLOGY NET OTHER AGENCY MORTGAGES NPE TRAVEL FLOW RATES NPE TECHNOLOGY NET OTHER CONVERTIDLES NE TRADCNC FUTURES FLOW RATES NPS PROF FEES RECRUITWENT FOUITY DERIVATIVES NPE TRADENPE SETTLEMENT FEES EQUITY DERIVATIVES NEE TRADENPE SETTLEMENT FEES FLOW RATES NPE OCCUPANCY OCC DEPRN FLOW RATES NPC OCCUPANCY OCC DEPRN FLOW RATES NPT OCCUPANCY OCC DCPRN FLOW RATES FLOW RATES NPE OCCUPANCY OCC DEPRN FLOW RATES NPS OCCUPANCY OCC DEPRN FLOW RATES NPE OCCUPANCY OCC DEPRN FLOW RATES NPS OCCUPANCY OCC DEPRN FLOW RATES NPC OCCUPANCY OCC DEPRN Equity Finance Rates Flow Rates Agency Mortgages Data--> Expense Data Revenue Data Sum of MONETARY_AMOUNT (5532,031.4) (5204,000,0) (5136,6927 (5105,000.0) ($90,702.) (501,928.4) (550 756.03 (556,4770) () (541,154,3) ($43,719.1) (535,709.9) (532.100.0) (531,500.0) (523,347 (519,585.9) ($19,570.33 (515,891.9) (58,8571) (59,7717) (58 387.6) (56,800.8) ($6,992.3) (56.220.1) (55,000.5) (55,744.7) (55,434.6) (54,404.9) ($4,403.5) (54,013.2) (54,3302) (53,8178) (53,511.5) (52,901.4) ($3,028.0) (52.995.1) (52,869.77 (52,4601) (52, 108.5) (51,432.9) ($1,112.5) (55112) (5521,3) (52674) (5292.6) ($158.3) $191.0 $221.9 5212.7 51888 52202 SA $20.0 $187.9 $202.7 32180 52-18 1 5219.9 $219.7 $245.1 5223.5 5245.11 $2283 5235.5 $229.3 $242.7 FLOW HATE SS DEY A D H 1 Scenario 2 Actual 3 Budget 4 Budget 5 Budget 6 Actual 7 Actual 8 Actual 9 Actual 10 Actual 11 Actual 12 Actual 13 Actual 14 Actual 15 Actual 16 Actual 17 Actual 18 Actual 19 Actual 20 Actual 21 Actual 22 Actual 23 Actual 24 Actual 25 Actual 26 Budget 27 Budget 28 Budget 29 Budget 30 Budget 31 Budget 32 Budget 33 Budget 34 Budget 35 Budget 36 Budget 37 Budget 38 Budget 39 Budget 40 Budget 41 Budget 42 Budget 43 Budget 44 Budget 45 Budget 46 Budget 47 Budget 48 Budget 49 Budget 50 Actual 51 Actual 52 Actual 53 Budget 54 Budget 55 Budget 56 Budget 57 Budget 58 Budget 59 Budget Instructions Ready AccessibilityInvestigate B L5 Equity Products Rates Equity Products Rates Rates Rates Equity Products Equity Products Equity Products Rates Equity Products Rates Equity Products Rates Equity Products Rates Equity Products Equity Products Equity Products Equity Products Rates Equity Products Rates Equity Products Rates Equity Products Rates Equity Products Rates Equity Products Rates Equity Products Rates Equity Products Rates Equity Products Rates Equity Products Rates Equity Products Rates Equity Products Rates Equity Products Rates Equity Products Rates Equity Products Rates Rates Rates Rates Rates Rates Rates Rates Rates Rates Global Markets Equity Products C - Product Equity Derivatives Flow Rates Equity Derivatives Agency Mortgages Flow Rates Agency Mortgages Equity Derivatives Equity Finance Convertibles Flow Rates Equity Derivatives Agency Mortgages Equity Derivatives Agency Mortgages Equity Derivatives Agency Mortgages Equity Derivatives Equity Derivatives Equity Derivatives Equity Derivatives Flow Rates Equity Derivatives Flow Rates Equity Derivatives Flow Rates Equity Derivatives Flow Rates Equity Derivatives Flow Rates Equity Derivatives Flow Rates Equity Derivatives Flow Rates Equity Derivatives Flow Rates Equity Derivatives Flow Rates Equity Derivatives Flow Rates Equity Derivatives Flow Rates Equity Derivatives Flow Rates Equity Derivatives Flow Rates Equity Derivatives Flow Rates Equity Derivatives Flow Rates Agency Mortgages Flow Rates Agency Mortgages Agency Mortgages Agency Mortgages Agency Mortgages Agency Mortgages Agency Mortgages Convertibles Equity Derivatives - Month 2022 YTD 2022 YTD 2022 YTD 2022 YTD 2022 YTD 2022 YTD 2021 Nov 2022 YTD 2022 YTD 2021 Apr 2021 Apr 2021 Apr 2021 May 2021 May 2021 Jun 2021 Jun 2021 Jul 2021 Aug 2021 Sep 2021 Oct 2021 Nov 2021 Dec 2022 Jan 2022 Jan 2021 Apr 2021 Apr 2021 May 2021 May 2021 Jun 2021 Jun 2021 Jul 2021 Jul 2021 Aug 2021 Aug 2021 Sep 2021 Sep 2021 Oct 2021 Oct 2021 Nov 2021 Nov 2021 Dec 2021 Dec 2022 Jan 2022 Jan 2022 Feb 2022 Feb 2022 Mar 2022 Mar 2021 Aug 2021 Sep 2021 Dec 2021 Apr 2021 May 2021 Jun 2021 Jul 2021 Aug 2021 Sep 2021 Oct Equity Finance E Account GBS_AC - Revenue GBS_AC - Revenue GBS AC - Revenue GBS AC - Revenue GBS_AC - Revenue GBS AC - Revenue GBS AC - Revenue GBS AC - Revenue GBS AC - Revenue GBS AC - Revenue GBS_AC - Revenue GBS AC - Revenue GBS AC - Revenue GBS AC - Revenue GBS AC - Revenue GBS AC - Revenue GBS AC - Revenue GBS AC - Revenue GBS AC - Revenue GBS AC - Revenue GBS AC - Revenue GBS AC - Revenue GBS AC - Revenue GBS AC - Revenue GBS AC - Revenue GBS AC - Revenue GBS AC - Revenue GBS AC - Revenue GBS_AC - Revenue GBS_AC - Revenue GBS AC - Revenue GBS AC - Revenue GBS AC - Revenue GBS AC - Revenue GBS AC - Revenue GBS_AC - Revenue GBS AC - Revenue GBS AC - Revenue GBS_AC - Revenue GBS AC - Revenue GBS AC - Revenue GBS AC - Revenue GBS AC - Revenue GBS AC - Revenue GBS_AC - Revenue GBS AC - Revenue GBS AC - Revenue GBS AC - Revenue GBS AC - Revenue GBS AC - Revenue GBS AC - Revenue GBS AC - Revenue GBS_AC - Revenue GBS AC - Revenue GBS AC - Revenue GBS AC - Revenue GBS AC - Revenue GBS AC - Revenue Agency Mortgages G Amount 360,000,000 333,333,333 333,333,333 291,666,667 270.000.000 230,000,000 30 000 000 50.000.000 47,000,000 40 000 000 40,000,000 40,000,000 40,000,000 40.000.000 10,000,000 40 000 000 40,000,000 40.000.000 40,000,000 40,000,000 40,000,000 40,000,000 40,000,000 40.000.000 33,333 333 33,333,333 33,333,333 33,333 333 33,333,333 33,333,333 33,333 333 33 333 333 33,333,333 33,333,333 33 333 333 33,333,333 33,333,333 33,333,333 33,333,333 33,333,333 33,333 333 33,333,333 33,333,333 33,333 333 33,333,333 33,333,333 33,333 333 33,333,333 30,000,000 30,000,000 30,000,000 29.166.667 29, 166,667 29,166.667 29, 166,667 29, 166,667 29, 166 667 29.166.667 Data--> Expense Data Agency Mortgage Rates Flow Rates Revenue Data #