Answered step by step
Verified Expert Solution
Link Copied!

Question

1 Approved Answer

This diagram is based on data for the weekend revenue based on the number of screens Fig 1. Relationship between number of screens and revenue
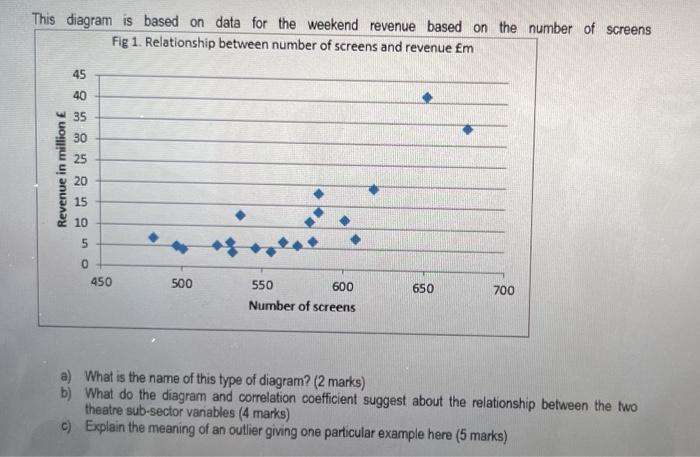
image text in transcribed
This diagram is based on data for the weekend revenue based on the number of screens Fig 1. Relationship between number of screens and revenue Em 45 40 35 30 25 Revenue in million E 20 15 10 5 0 450 500 650 550 600 Number of screens 700 a) What is the name of this type of diagram? (2 marks) b) What do the diagram and correlation coefficient suggest about the relationship between the two theatre sub-sector variables (4 marks) c) Explain the meaning of an outlier giving one particular example here

Step by Step Solution

There are 3 Steps involved in it

Step: 1

blur-text-image

Get Instant Access to Expert-Tailored Solutions

See step-by-step solutions with expert insights and AI powered tools for academic success

Step: 2

blur-text-image

Step: 3

blur-text-image

Ace Your Homework with AI

Get the answers you need in no time with our AI-driven, step-by-step assistance

Get Started

Recommended Textbook for

How To Save It Fix Your Finances

Authors: Bola Sol

1st Edition

1529118816, 978-1529118810

More Books

Students also viewed these Finance questions

Question

Answered: 1 week ago

Answered: 1 week ago