Answered step by step
Verified Expert Solution
Question
1 Approved Answer
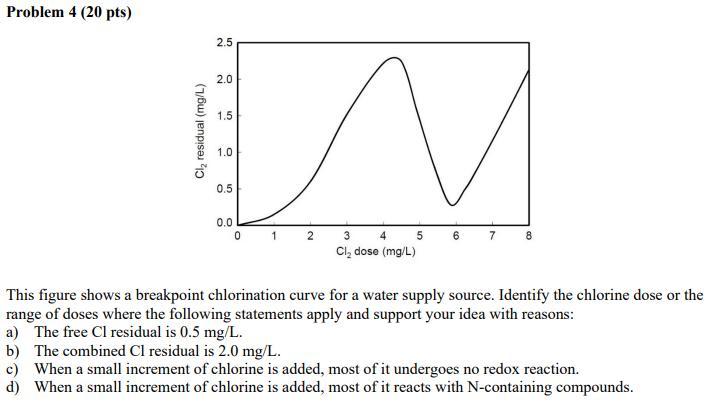
This figure shows a breakpoint chlorination curve for a water supply source. Identify the chlorine dose or the range of doses where the following statements

This figure shows a breakpoint chlorination curve for a water supply source. Identify the chlorine dose or the range of doses where the following statements apply and support your idea with reasons:
a) The free Cl residual is 0.5 mg/L.
b) The combined Cl residual is 2.0 mg/L.
c) When a small increment of chlorine is added, most of it undergoes no redox reaction.
d) When a small increment of chlorine is added, most of it reacts with N-containing compounds.
Problem 4 (20 pts) 2.5 2.0 1.5 Cl, residual (mg/L) v 1.0 0.5 0.0 0 1 2 3 4 5 Cl, dose (mg/L) This figure shows a breakpoint chlorination curve for a water supply source. Identify the chlorine dose or the range of doses where the following statements apply and support your idea with reasons: a) The free Cl residual is 0.5 mg/L. b) The combined Cl residual is 2.0 mg/L. c) When a small increment of chlorine is added, most of it undergoes no redox reaction. d) When a small increment of chlorine is added, most of it reacts with N-containing compoundsStep by Step Solution
There are 3 Steps involved in it
Step: 1

Get Instant Access to Expert-Tailored Solutions
See step-by-step solutions with expert insights and AI powered tools for academic success
Step: 2

Step: 3

Ace Your Homework with AI
Get the answers you need in no time with our AI-driven, step-by-step assistance
Get Started


