

Question: This file goes fully analyzes a propose option to expand the brewery by purchasing capital equipment (a 100-barrel tank). For this assignment you will analyze
This file goes fully analyzes a propose option to expand the brewery by purchasing capital equipment (a 100-barrel tank). For this assignment you will analyze a second project and compare it to the "Brewery Expansion" project. This second potential project is described below.
Suppose the same brewery is evaluating an additional option. The brewery is considering purchasing oak barrels to produce high-end, barrel-aged, beers. The relevant input information and project details are described below. Adjustments for sensitivity and scenario analysis are listed in parentheses following the base case information as (best case, worst case).
The brewery plans to purchase 50 barrels at an expected cost of $200 per barrel. However, there is a chance they may receive the barrels for free from a winery, and there is a chance they may have to pay $300/barrel if there is a shortage. There is no salvage value for the barrels.
Cost of oak barrel: $200/barrel (-100%, +50%)
Unlike the tank, which can produce a monthly lot of beer, beer now needs to be aged for likely a year. However, some beers may mature in as little as 6 months or as long as 2 years. There are 300 beers produced per batch per barrel. (Also assume, as is the case in the original brewery expansion, 55%, 75%, 95%, and 100% of production capacity is realized as actual sales in years 1-4; see F9:I9.)
Production time for oak barrel: 1 year (-50%, +100%)
The barrel-aged beers are premium products which are expected to sell for $10 per bottle (same size as beers from a tank). If the beer turns out worse than expected, the brewery will have to slash the price to $5 per bottle. However, if the beer turns out better than expected, the brewery may be able to charge $20 per bottle.
Market price: $10 (+100%, -50%)
Variable costs, fixed costs, and WACC have little uncertainty and only fluctuate by 10%.
Annual variable cost: $90,000, VC/unit (-10%, +10%)
Annual fixed cost: $30,000 (-10%, +10%)
WACC: 10% (-10%, +10%)
Repeat all analysis (project analysis, sensitivity analysis, scenario analysis) performed in the original Brewery Expansion project for the new barrel-aging project. In 1-2 paragraphs, summarize your findings and compare the projects.
Suppose there is a 2% chance the barrel-aging program catches the attention of a large brewery, leading to a $10,000,000 investment from the large brewery at the end of the project.
In a new sheet, recalculate and report the NPV of the barrel-aging expansion project (at base case values, no sensitivity analysis). Compare this value with the NPV of the original expansion project.
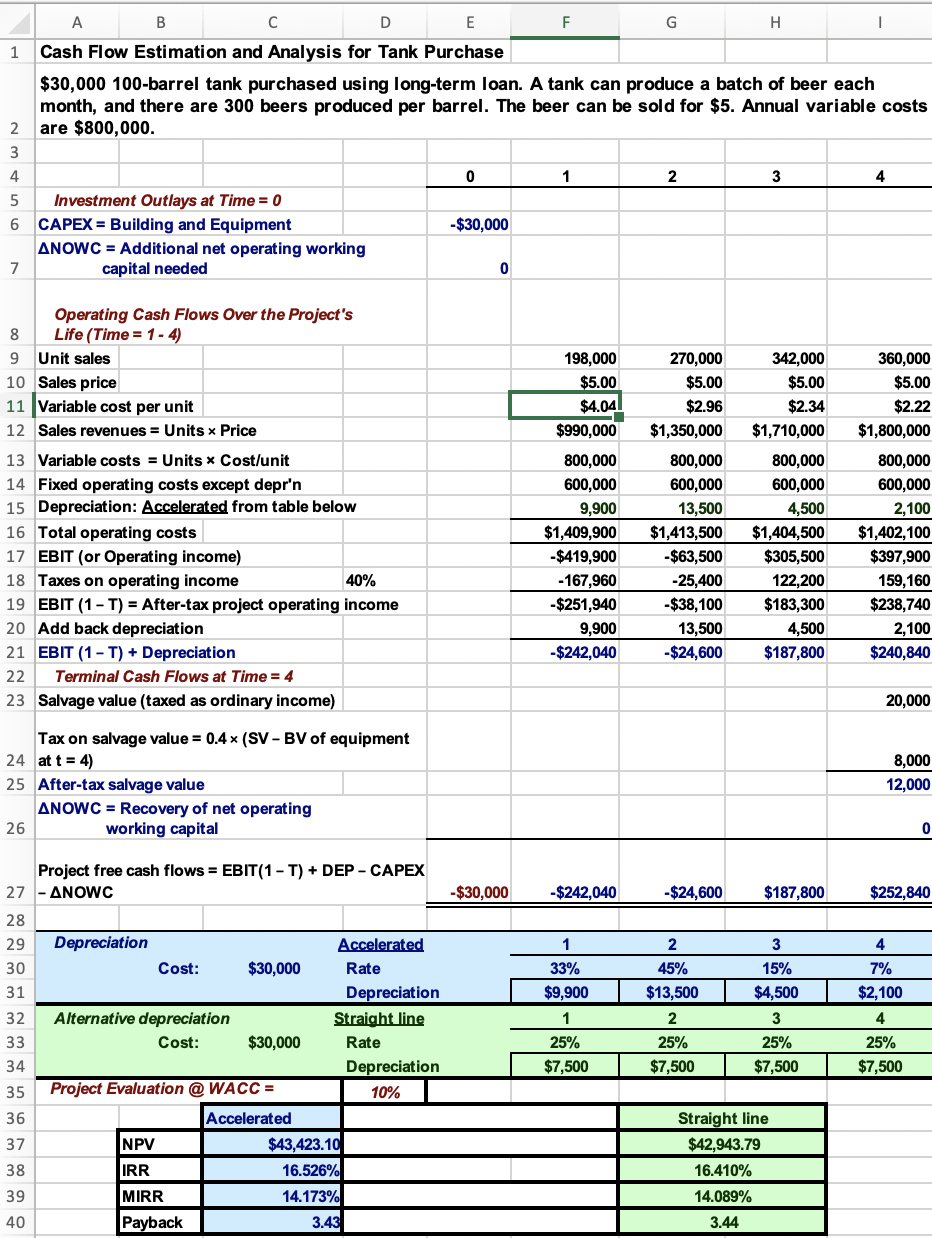
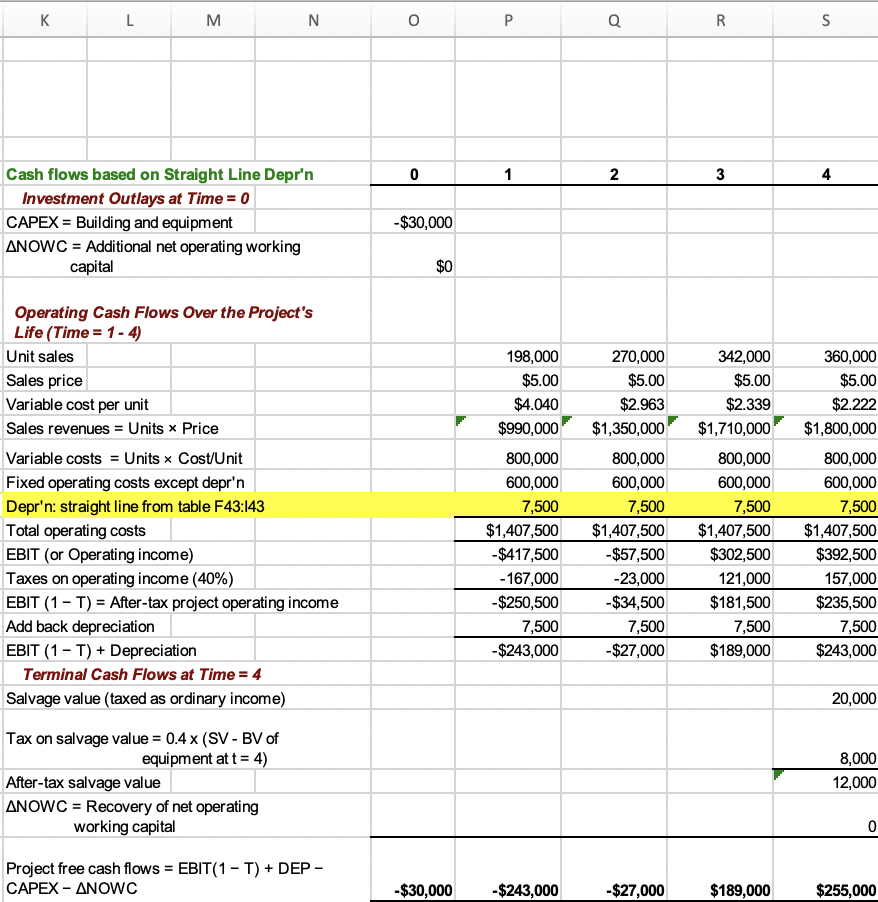
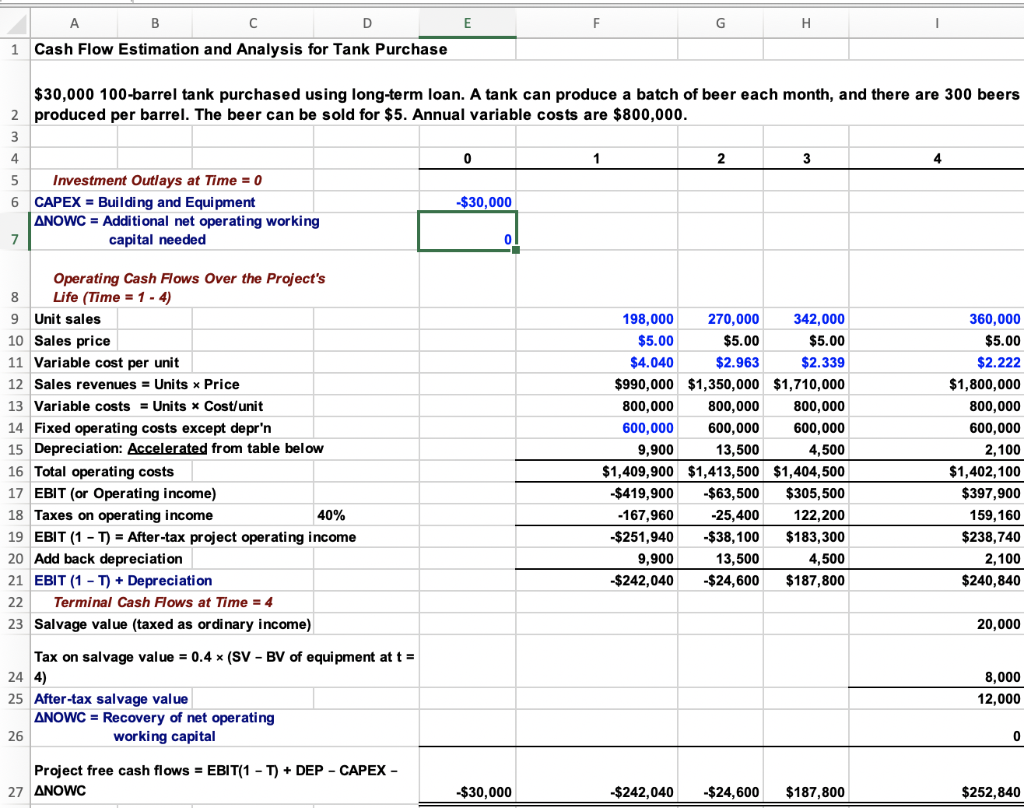
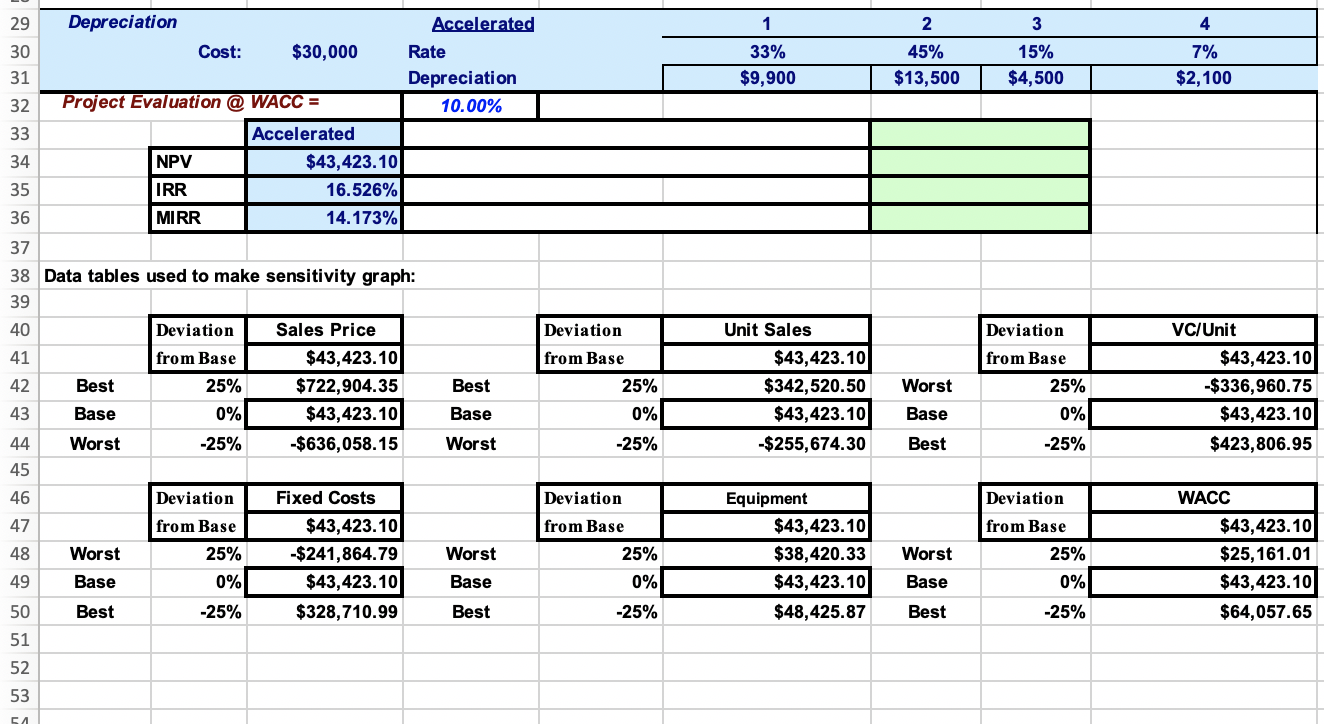
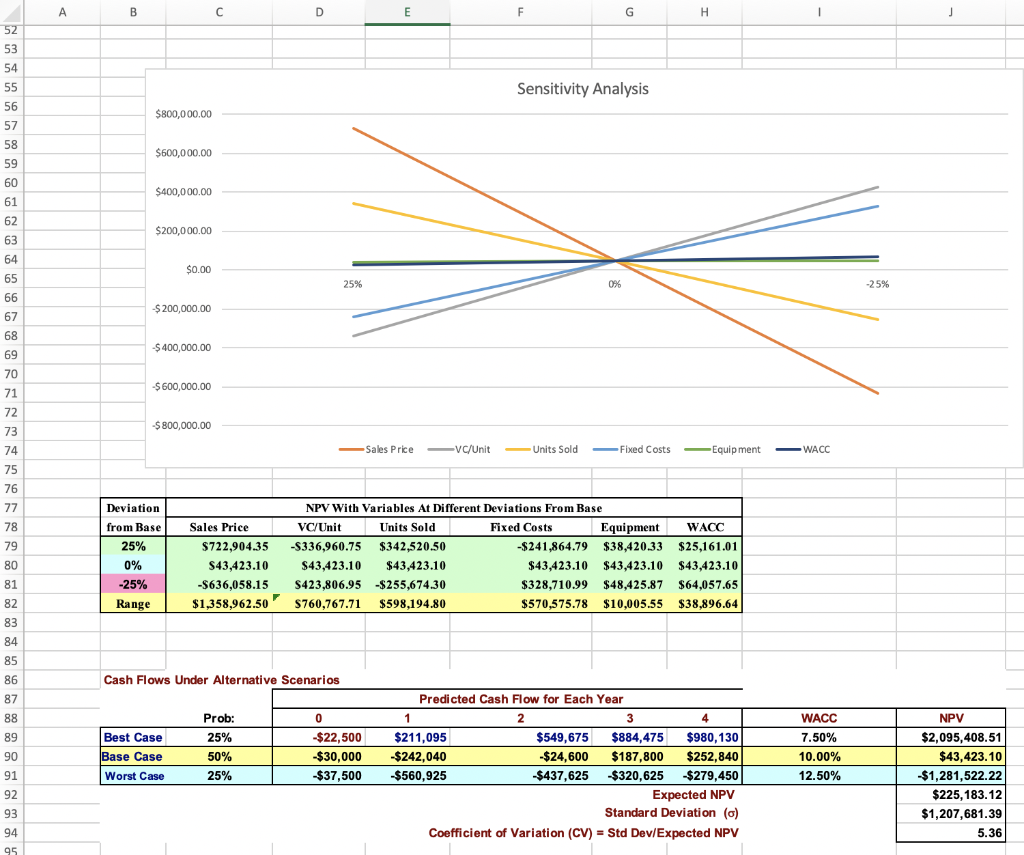
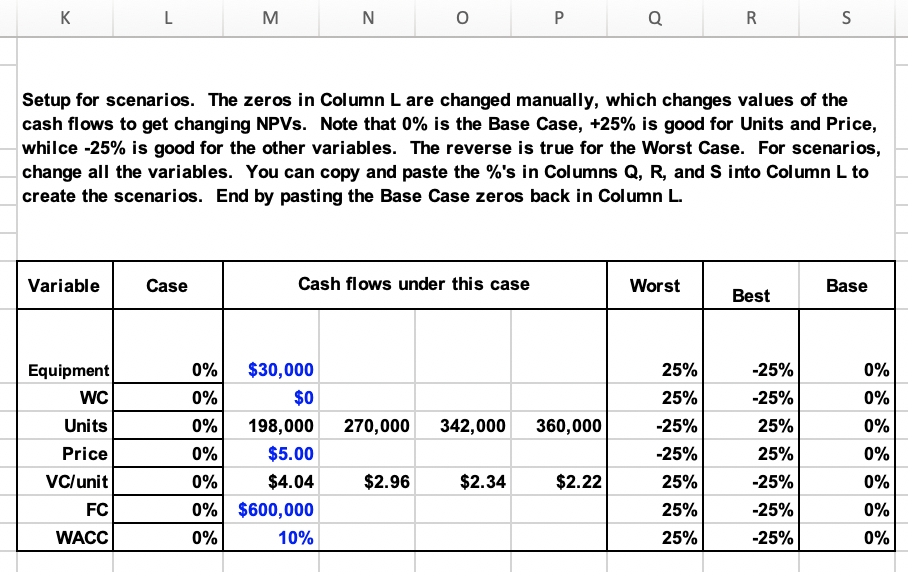
A B D E F 1 Cash Flow Estimation and Analysis for Tank Purchase $30,000 100-barrel tank purchased using long-term loan. A tank can produce a batch of beer each month, and there are 300 beers produced per barrel. The beer can be sold for $5. Annual variable costs are $800,000. nmt in 0 1 2 6 -$30,000 Investment Outlays at Time = 0 CAPEX = Building and Equipment and Equinment ANOWC = Additional net operating working capital needed 198,000 $5.00 $4.04. $990,000 270,000 $5.00 $2.96 $1,350,000 Operating Cash Flows Over the Project's 8 Life (Time = 1 - 4) 9 Unit sales 10 Sales price 11 Variable cost per unit 12 Sales revenues = Units x Price 13 Variable costs = Units X Cost/unit 14 Fixed operating costs except depr'n 15 Depreciation: Accelerated from table below 16 Total operating costs 17 EBIT (or Operating income) 18 Taxes on operating income 40% 19 EBIT (1-T) = After-tax project operating income 20 Add back depreciation 21 EBIT (1 - T) + Depreciation 22 Terminal Cash Flows at Time = 4 23 Salvage value (taxed as ordinary income) 800,000 600,000 9,900 $1,409,900 -$419,900 - 167,960 -$251,940 9,900 -$242,040 800,000 600,000 13,500 $1,413,500 - $63,500 -25,400 -$38,100 13,500 -$24,600 342,000 $5.00 $2.34 $1,710,000 800,000 600,000 4,500 $1,404,500 $305,500 122,200 $183,300 4,500 $187,800 360,000 $5.00 $2.22 $1,800,000 800,000 600,000 2,100 $1,402,100 $397,900 159,160 $238,740 2,100 $240,840 20,000 Tax on salvage value = 0.4* (SV - BV of equipment 24 at t = 4) 25 After-tax salvage value ANOWC = Recovery of net operating working capital 8,000 12,000 26 Project free cash flows = EBIT(1-T) + DEP - CAPEX 27 - ANOWC -$30,000 - $242,040 -$24,600 $187,800 $252,840 - 30 1 33% $9,900 1 25% $7,500 2 45% $13,500 2 25% $7,500 3 15% $4,500 3 25% $7,500 4 7% $2,100 4 25% $7,500 | Depreciation Accelerated Cost: $30,000 Rate Depreciation Alternative depreciation Straight line Cost: $30,000 Rate Depreciation Project Evaluation @ WACC = 10% Accelerated NPV $43,423.10 IRR 16.526% MIRR 14.173% Payback 3.43 1 Straight line $42,943.79 16.410% 14.089% 3.44 M N O P Q R 0 1 2 Cash flows based on Straight Line Depr'n Investment Outlays at Time = 0 CAPEX = Building and equipment ANOWC = Additional net operating working capital -$30,000 198,000 $5.00 $4.040 $990,000 270,000 $5.00 $2.963 $1,350,000 360,000 $5.00 $2.222 $1,800,000 Operating Cash Flows Over the Project's Life (Time = 1 - 4 Unit sales Sales price Variable cost per unit Sales revenues = Units Price Variable costs = Units x Cost/Unit Fixed operating costs except depr'n Depr'n: straight line from table F43:143 Total operating costs EBIT (or Operating income) Taxes on operating income (40%) EBIT (1 - T) = After-tax project operating income Add back depreciation EBIT (1 - T) + Depreciation Terminal Cash Flows at Time = 4 Salvage value (taxed as ordinary income) 800,000 600,000 7,500 $1,407,500 -$417,500 - 167,000 -$250,500 7,500 -$243,000 800,000 600,000 7,500 $1,407,500 -$57,500 -23,000 -$34,500 7,500 -$27,000 342,000 $5.00 $2.339 $1,710,000 800,000 600,000 7,500 $1,407,500 $302,500 121,000 $181,500 7,500 $189,000 800,000 600,000 7,500 $1,407,500 $392,500 157,000 $235,500 7,500 $243,000 20,000 Tax on salvage value = 0.4 x (SV - BV of equipment at t = 4) After-tax salvage value ANOWC = Recovery of net operating working capital 8,000 12,000 0 Project free cash flows = EBIT(1 - T) + DEP - CAPEX - ANOWC -$30,000 -$243,000 -$27,000 $189,000 $255,000 1 Cash Flow Estimation and Analysis for Tank Purchase $30,000 100-barrel tank purchased using long-term loan. A tank can produce a batch of beer each month, and there are 300 beers 2 produced per barrel. The beer can be sold for $5. Annual variable costs are $800,000. $30,000 Investment Outlays at Time = 0 6 CAPEX = Building and Equipment ANOWC = Additional net operating working capital needed Operating Cash Flows Over the Project's 8 Life (Time = 1 - 4) 9 Unit sales 10 Sales price 11 Variable cost per unit 12 Sales revenues = Units x Price 13 Variable costs = Units X Cost/unit 14 Fixed operating costs except depr'n 15 Depreciation: Accelerated from table below 16 Total operating costs 17 EBIT (or Operating income) 18 Taxes on operating income 40% 19 EBIT (1 - T) = After-tax project operating income 20 Add back depreciation 21 EBIT (1 - T) + Depreciation 22 Terminal Cash Flows at Time = 4 23 Salvage value (taxed as ordinary income) 198,000 270,000 342,000 $5.00 $5.00 $5.00 $4.040 $2.963 $2.339 $990,000 $1,350,000 $1,710,000 800,000 800,000 800,000 600,000 600,000 600,000 9,900 13,500 4,500 $1,409,900 $1,413,500 $1,404,500 -$419,900 $63,500 $305,500 -167,960 -25,400 122,200 -$251,940 -$38,100 $183,300 9,900 13,500 4,500 $242,040 - $24,600 $187,800 360,000 $5.00 $2.222 $1,800,000 800,000 600,000 2,100 $1,402,100 $397,900 159, 160 $238,740 2,100 $240,840 20,000 Tax on salvage value = 0.4 (SV - BV of equipment at t = 24 4) 25 After-tax salvage value ANOWC = Recovery of net operating 26 working capital 8,000 12,000 Project free cash flows = EBIT(1 - T) + DEP - CAPEX - 27 ANOWC -$30,000 -$242,040 - $24,600 $187,800 $252,840 Depreciation - Cost: $30,000 Accelerated Rate Depreciation 10.00% 1 33% $9,900 2 45% $13,500 3 15% $4,500 4 7% $2,100 Project Evaluation @ WACC = Accelerated NPV $43,423.10 IRR 16.526% MIRR 14.173% Data tables used to make sensitivity graph: Deviation from Base 25% 0% -25% Best Base Worst Sales Price $43,423.10 $722,904.35 $43,423.10 $636,058.15 Deviation from Base 25% 0% -25% Deviation from Base 25% 0% Best Base Unit Sales $43,423.10 $342,520.50 $43,423.10 -$255,674.30 Worst Base Best VC/Unit $43,423.10 -$336,960.75 $43,423.10 $423,806.95 Worst -25% Worst Base Deviation from Base 25% 0% -25% Fixed Costs $43,423.10 -$241,864.79 $43,423.10 $328,710.99 Worst Base Best Deviation from Base 25% 0% -25% Equipment $43,423.10 $38,420.33 $43,423.10 $48,425.87 Worst Base Best Deviation from Base 25% 0% -25% WACC $43,423.10 $25,161.01 $43,423.10 $64,057.65 Best Sensitivity Analysis $800,000.00 $600,000.00 $400,000.00 $200,000.00 $0.00 25% 0% -25% $ 200,000.00 $ 400,000.00 $ 600,000.00 $800,000.00 Sales Price VC/Unit Units Sold Fixed Costs Equipment WACC Deviation from Base 25% 0% -25% Range Sales Price $722,904.35 S43,423.10 -$636,058.15 $1,358,962.50 NPV With Variables At Different Deviations From Base VC/Unit Units Sold Fixed Costs Equipment -$336,960.75 $342,520.50 -$241,864.79 $38,420.33 $43,423.10 $43,423.10 $43,423.10 $43,423.10 S423,806.95 $255,674.30 $328,710.99 $48,425.87 $760,767.71 $598,194.80 $570,575.78 $10,005,55 WACC $25,161.01 $43,423.10 $64,057.65 $38,896.64 Cash Flows Under Alternative Scenarios Predicted Cash Flow for Each Year 1 3 NPV Best Case Base Case Worst Case Prob: 25% 50% 25% -$22,500 $30,000 $37,500 4 $211,095 $549,675 $884,475 $980,130 $242,040 $24,600 $187,800 $252,840 | $560,925 $437,625 $320,625 $279,450 Expected NPV Standard Deviation (o) Coefficient of Variation (CV) = Std Dev/Expected NPV WACC 7.50% 10.00% 12.50% $2,095,408.51 $43,423.10 $1,281,522.22 $225, 183.12 $1,207,681.39 5.36 . R S Setup for scenarios. The zeros in Column L are changed manually, which changes values of the cash flows to get changing NPVs. Note that 0% is the Base Case, +25% is good for Units and Price, whilce -25% is good for the other variables. The reverse is true for the Worst Case. For scenarios, change all the variables. You can copy and paste the %'s in Columns Q, R, and Sinto Column L to create the scenarios. End by pasting the Base Case zeros back in Column L. Variable Case Cash flows under this case Worst Best Base Equipment 0% 0% WC 0% 0% | 270,000 342,000 360,000 0% 0% Units Price VC/unit FC WACC $30,000 $0 198,000 $5.00 $4.04 $600,000 10% 25% 25% -25% -25% 25% 25% 25% -25% -25% 25% 25% -25% -25% -25% 0% 0% $2.96 $2.34 $2.22 0% 0% 0% 0% 0% A B D E F 1 Cash Flow Estimation and Analysis for Tank Purchase $30,000 100-barrel tank purchased using long-term loan. A tank can produce a batch of beer each month, and there are 300 beers produced per barrel. The beer can be sold for $5. Annual variable costs are $800,000. nmt in 0 1 2 6 -$30,000 Investment Outlays at Time = 0 CAPEX = Building and Equipment and Equinment ANOWC = Additional net operating working capital needed 198,000 $5.00 $4.04. $990,000 270,000 $5.00 $2.96 $1,350,000 Operating Cash Flows Over the Project's 8 Life (Time = 1 - 4) 9 Unit sales 10 Sales price 11 Variable cost per unit 12 Sales revenues = Units x Price 13 Variable costs = Units X Cost/unit 14 Fixed operating costs except depr'n 15 Depreciation: Accelerated from table below 16 Total operating costs 17 EBIT (or Operating income) 18 Taxes on operating income 40% 19 EBIT (1-T) = After-tax project operating income 20 Add back depreciation 21 EBIT (1 - T) + Depreciation 22 Terminal Cash Flows at Time = 4 23 Salvage value (taxed as ordinary income) 800,000 600,000 9,900 $1,409,900 -$419,900 - 167,960 -$251,940 9,900 -$242,040 800,000 600,000 13,500 $1,413,500 - $63,500 -25,400 -$38,100 13,500 -$24,600 342,000 $5.00 $2.34 $1,710,000 800,000 600,000 4,500 $1,404,500 $305,500 122,200 $183,300 4,500 $187,800 360,000 $5.00 $2.22 $1,800,000 800,000 600,000 2,100 $1,402,100 $397,900 159,160 $238,740 2,100 $240,840 20,000 Tax on salvage value = 0.4* (SV - BV of equipment 24 at t = 4) 25 After-tax salvage value ANOWC = Recovery of net operating working capital 8,000 12,000 26 Project free cash flows = EBIT(1-T) + DEP - CAPEX 27 - ANOWC -$30,000 - $242,040 -$24,600 $187,800 $252,840 - 30 1 33% $9,900 1 25% $7,500 2 45% $13,500 2 25% $7,500 3 15% $4,500 3 25% $7,500 4 7% $2,100 4 25% $7,500 | Depreciation Accelerated Cost: $30,000 Rate Depreciation Alternative depreciation Straight line Cost: $30,000 Rate Depreciation Project Evaluation @ WACC = 10% Accelerated NPV $43,423.10 IRR 16.526% MIRR 14.173% Payback 3.43 1 Straight line $42,943.79 16.410% 14.089% 3.44 M N O P Q R 0 1 2 Cash flows based on Straight Line Depr'n Investment Outlays at Time = 0 CAPEX = Building and equipment ANOWC = Additional net operating working capital -$30,000 198,000 $5.00 $4.040 $990,000 270,000 $5.00 $2.963 $1,350,000 360,000 $5.00 $2.222 $1,800,000 Operating Cash Flows Over the Project's Life (Time = 1 - 4 Unit sales Sales price Variable cost per unit Sales revenues = Units Price Variable costs = Units x Cost/Unit Fixed operating costs except depr'n Depr'n: straight line from table F43:143 Total operating costs EBIT (or Operating income) Taxes on operating income (40%) EBIT (1 - T) = After-tax project operating income Add back depreciation EBIT (1 - T) + Depreciation Terminal Cash Flows at Time = 4 Salvage value (taxed as ordinary income) 800,000 600,000 7,500 $1,407,500 -$417,500 - 167,000 -$250,500 7,500 -$243,000 800,000 600,000 7,500 $1,407,500 -$57,500 -23,000 -$34,500 7,500 -$27,000 342,000 $5.00 $2.339 $1,710,000 800,000 600,000 7,500 $1,407,500 $302,500 121,000 $181,500 7,500 $189,000 800,000 600,000 7,500 $1,407,500 $392,500 157,000 $235,500 7,500 $243,000 20,000 Tax on salvage value = 0.4 x (SV - BV of equipment at t = 4) After-tax salvage value ANOWC = Recovery of net operating working capital 8,000 12,000 0 Project free cash flows = EBIT(1 - T) + DEP - CAPEX - ANOWC -$30,000 -$243,000 -$27,000 $189,000 $255,000 1 Cash Flow Estimation and Analysis for Tank Purchase $30,000 100-barrel tank purchased using long-term loan. A tank can produce a batch of beer each month, and there are 300 beers 2 produced per barrel. The beer can be sold for $5. Annual variable costs are $800,000. $30,000 Investment Outlays at Time = 0 6 CAPEX = Building and Equipment ANOWC = Additional net operating working capital needed Operating Cash Flows Over the Project's 8 Life (Time = 1 - 4) 9 Unit sales 10 Sales price 11 Variable cost per unit 12 Sales revenues = Units x Price 13 Variable costs = Units X Cost/unit 14 Fixed operating costs except depr'n 15 Depreciation: Accelerated from table below 16 Total operating costs 17 EBIT (or Operating income) 18 Taxes on operating income 40% 19 EBIT (1 - T) = After-tax project operating income 20 Add back depreciation 21 EBIT (1 - T) + Depreciation 22 Terminal Cash Flows at Time = 4 23 Salvage value (taxed as ordinary income) 198,000 270,000 342,000 $5.00 $5.00 $5.00 $4.040 $2.963 $2.339 $990,000 $1,350,000 $1,710,000 800,000 800,000 800,000 600,000 600,000 600,000 9,900 13,500 4,500 $1,409,900 $1,413,500 $1,404,500 -$419,900 $63,500 $305,500 -167,960 -25,400 122,200 -$251,940 -$38,100 $183,300 9,900 13,500 4,500 $242,040 - $24,600 $187,800 360,000 $5.00 $2.222 $1,800,000 800,000 600,000 2,100 $1,402,100 $397,900 159, 160 $238,740 2,100 $240,840 20,000 Tax on salvage value = 0.4 (SV - BV of equipment at t = 24 4) 25 After-tax salvage value ANOWC = Recovery of net operating 26 working capital 8,000 12,000 Project free cash flows = EBIT(1 - T) + DEP - CAPEX - 27 ANOWC -$30,000 -$242,040 - $24,600 $187,800 $252,840 Depreciation - Cost: $30,000 Accelerated Rate Depreciation 10.00% 1 33% $9,900 2 45% $13,500 3 15% $4,500 4 7% $2,100 Project Evaluation @ WACC = Accelerated NPV $43,423.10 IRR 16.526% MIRR 14.173% Data tables used to make sensitivity graph: Deviation from Base 25% 0% -25% Best Base Worst Sales Price $43,423.10 $722,904.35 $43,423.10 $636,058.15 Deviation from Base 25% 0% -25% Deviation from Base 25% 0% Best Base Unit Sales $43,423.10 $342,520.50 $43,423.10 -$255,674.30 Worst Base Best VC/Unit $43,423.10 -$336,960.75 $43,423.10 $423,806.95 Worst -25% Worst Base Deviation from Base 25% 0% -25% Fixed Costs $43,423.10 -$241,864.79 $43,423.10 $328,710.99 Worst Base Best Deviation from Base 25% 0% -25% Equipment $43,423.10 $38,420.33 $43,423.10 $48,425.87 Worst Base Best Deviation from Base 25% 0% -25% WACC $43,423.10 $25,161.01 $43,423.10 $64,057.65 Best Sensitivity Analysis $800,000.00 $600,000.00 $400,000.00 $200,000.00 $0.00 25% 0% -25% $ 200,000.00 $ 400,000.00 $ 600,000.00 $800,000.00 Sales Price VC/Unit Units Sold Fixed Costs Equipment WACC Deviation from Base 25% 0% -25% Range Sales Price $722,904.35 S43,423.10 -$636,058.15 $1,358,962.50 NPV With Variables At Different Deviations From Base VC/Unit Units Sold Fixed Costs Equipment -$336,960.75 $342,520.50 -$241,864.79 $38,420.33 $43,423.10 $43,423.10 $43,423.10 $43,423.10 S423,806.95 $255,674.30 $328,710.99 $48,425.87 $760,767.71 $598,194.80 $570,575.78 $10,005,55 WACC $25,161.01 $43,423.10 $64,057.65 $38,896.64 Cash Flows Under Alternative Scenarios Predicted Cash Flow for Each Year 1 3 NPV Best Case Base Case Worst Case Prob: 25% 50% 25% -$22,500 $30,000 $37,500 4 $211,095 $549,675 $884,475 $980,130 $242,040 $24,600 $187,800 $252,840 | $560,925 $437,625 $320,625 $279,450 Expected NPV Standard Deviation (o) Coefficient of Variation (CV) = Std Dev/Expected NPV WACC 7.50% 10.00% 12.50% $2,095,408.51 $43,423.10 $1,281,522.22 $225, 183.12 $1,207,681.39 5.36 . R S Setup for scenarios. The zeros in Column L are changed manually, which changes values of the cash flows to get changing NPVs. Note that 0% is the Base Case, +25% is good for Units and Price, whilce -25% is good for the other variables. The reverse is true for the Worst Case. For scenarios, change all the variables. You can copy and paste the %'s in Columns Q, R, and Sinto Column L to create the scenarios. End by pasting the Base Case zeros back in Column L. Variable Case Cash flows under this case Worst Best Base Equipment 0% 0% WC 0% 0% | 270,000 342,000 360,000 0% 0% Units Price VC/unit FC WACC $30,000 $0 198,000 $5.00 $4.04 $600,000 10% 25% 25% -25% -25% 25% 25% 25% -25% -25% 25% 25% -25% -25% -25% 0% 0% $2.96 $2.34 $2.22 0% 0% 0% 0% 0%
Step by Step Solution
There are 3 Steps involved in it

Get step-by-step solutions from verified subject matter experts