This final exam is composed of three parts. The first part consists of 10 items/questions based on a hypothetical data of Covid-19 patients admitted to
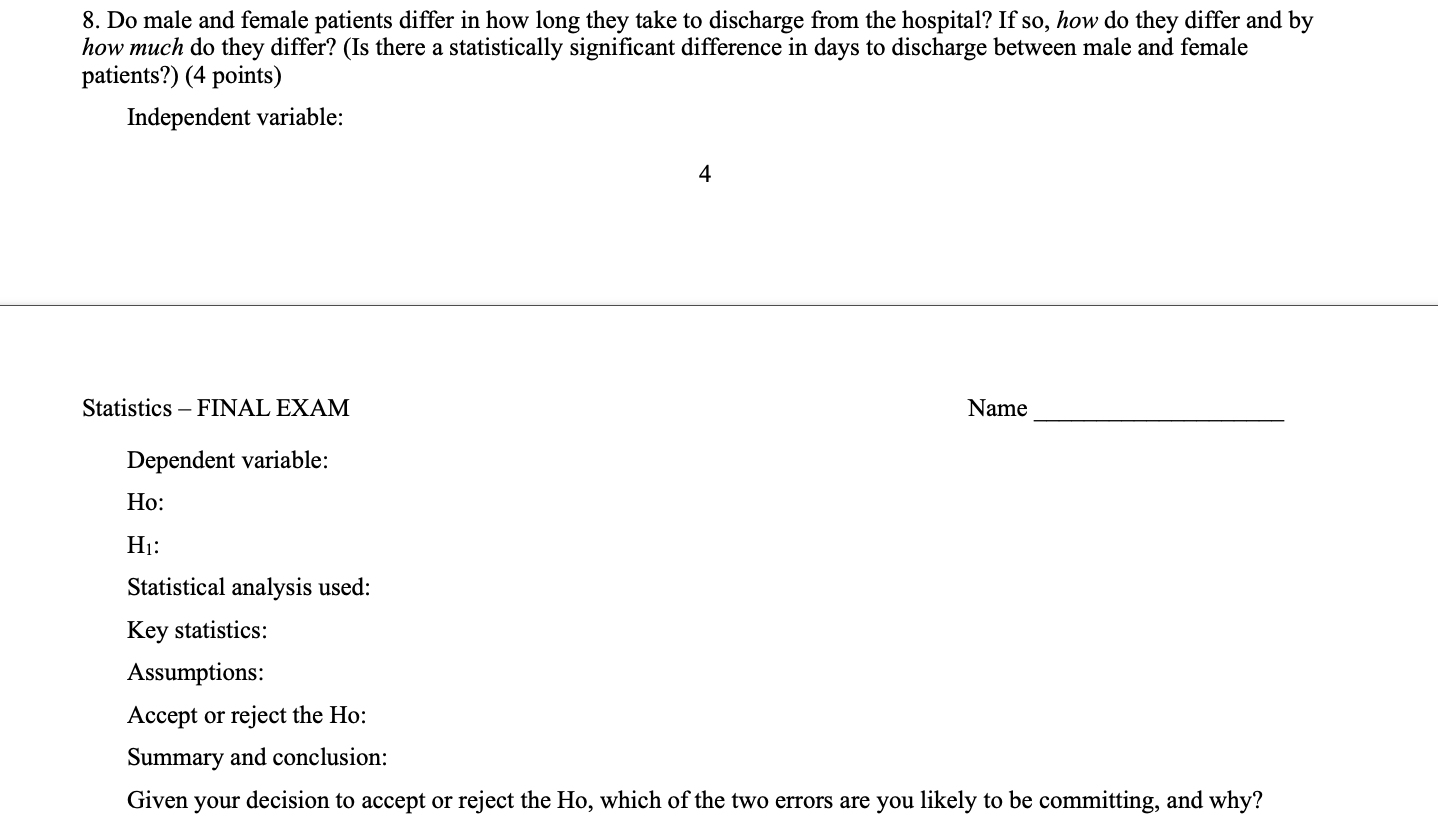
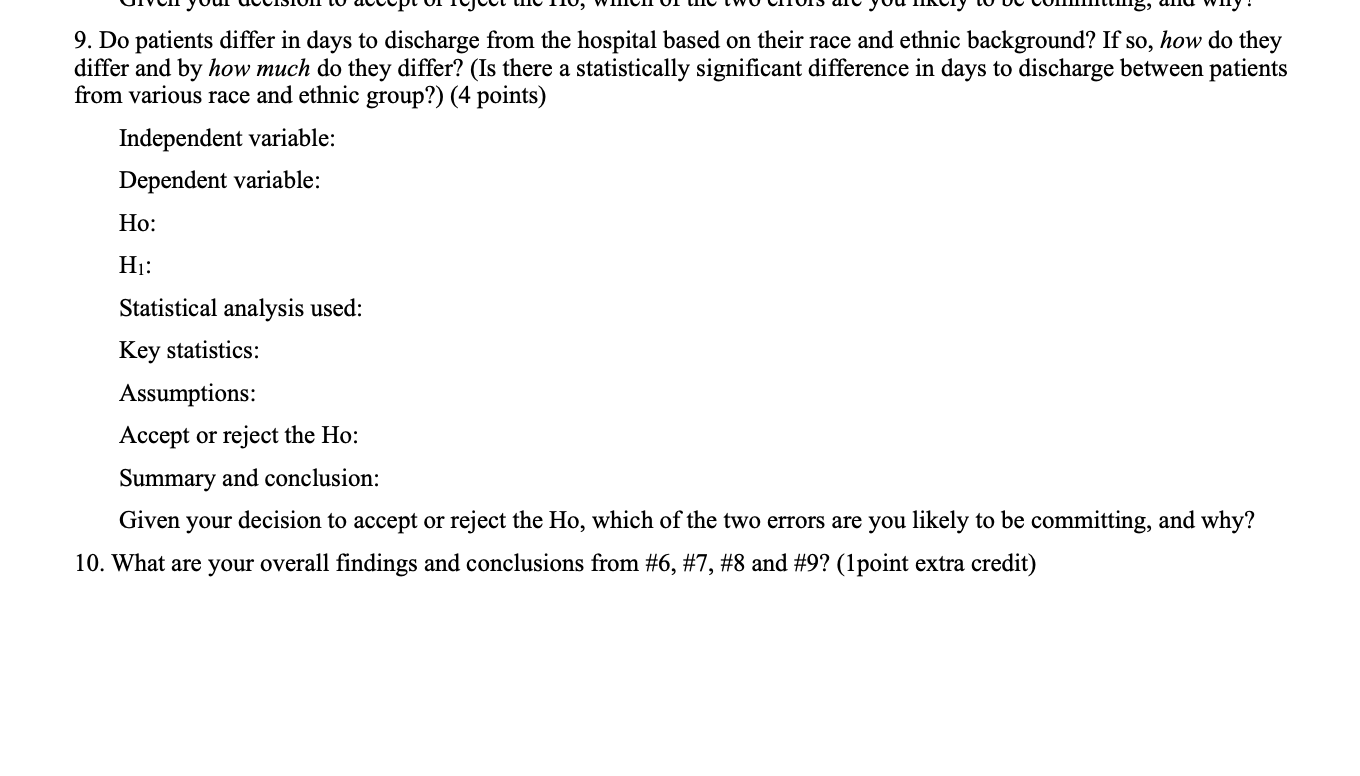
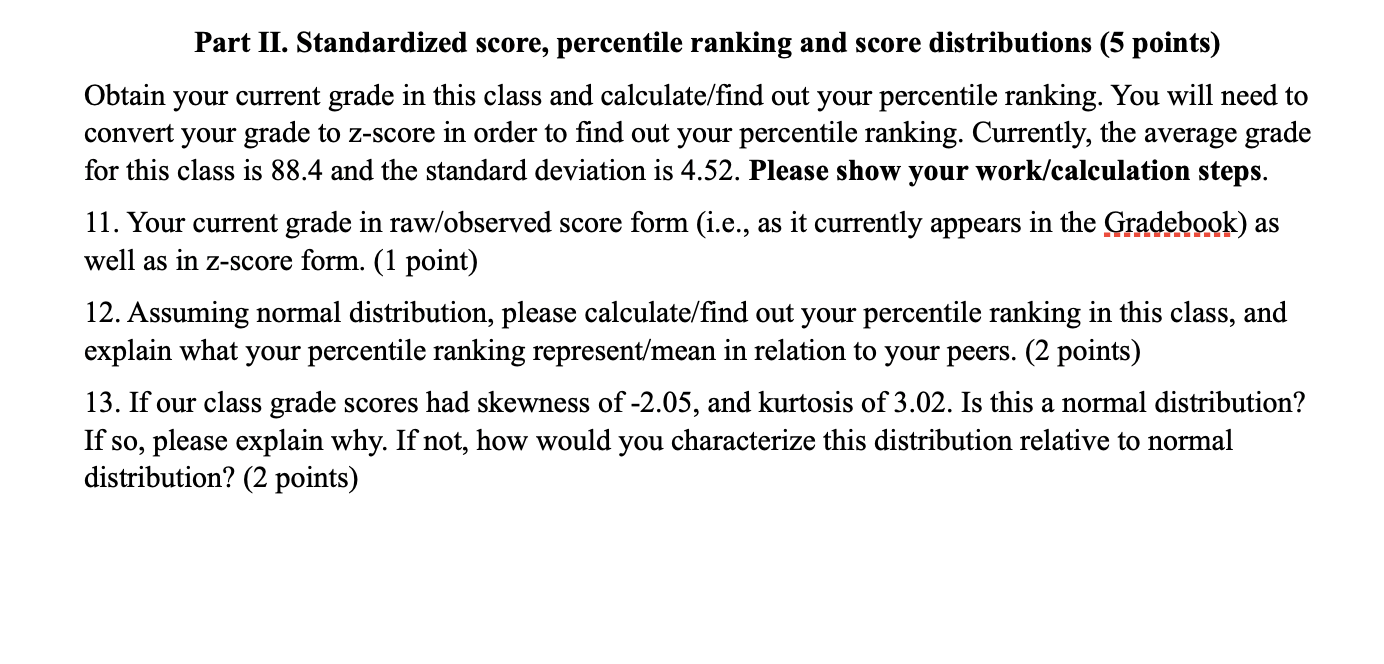
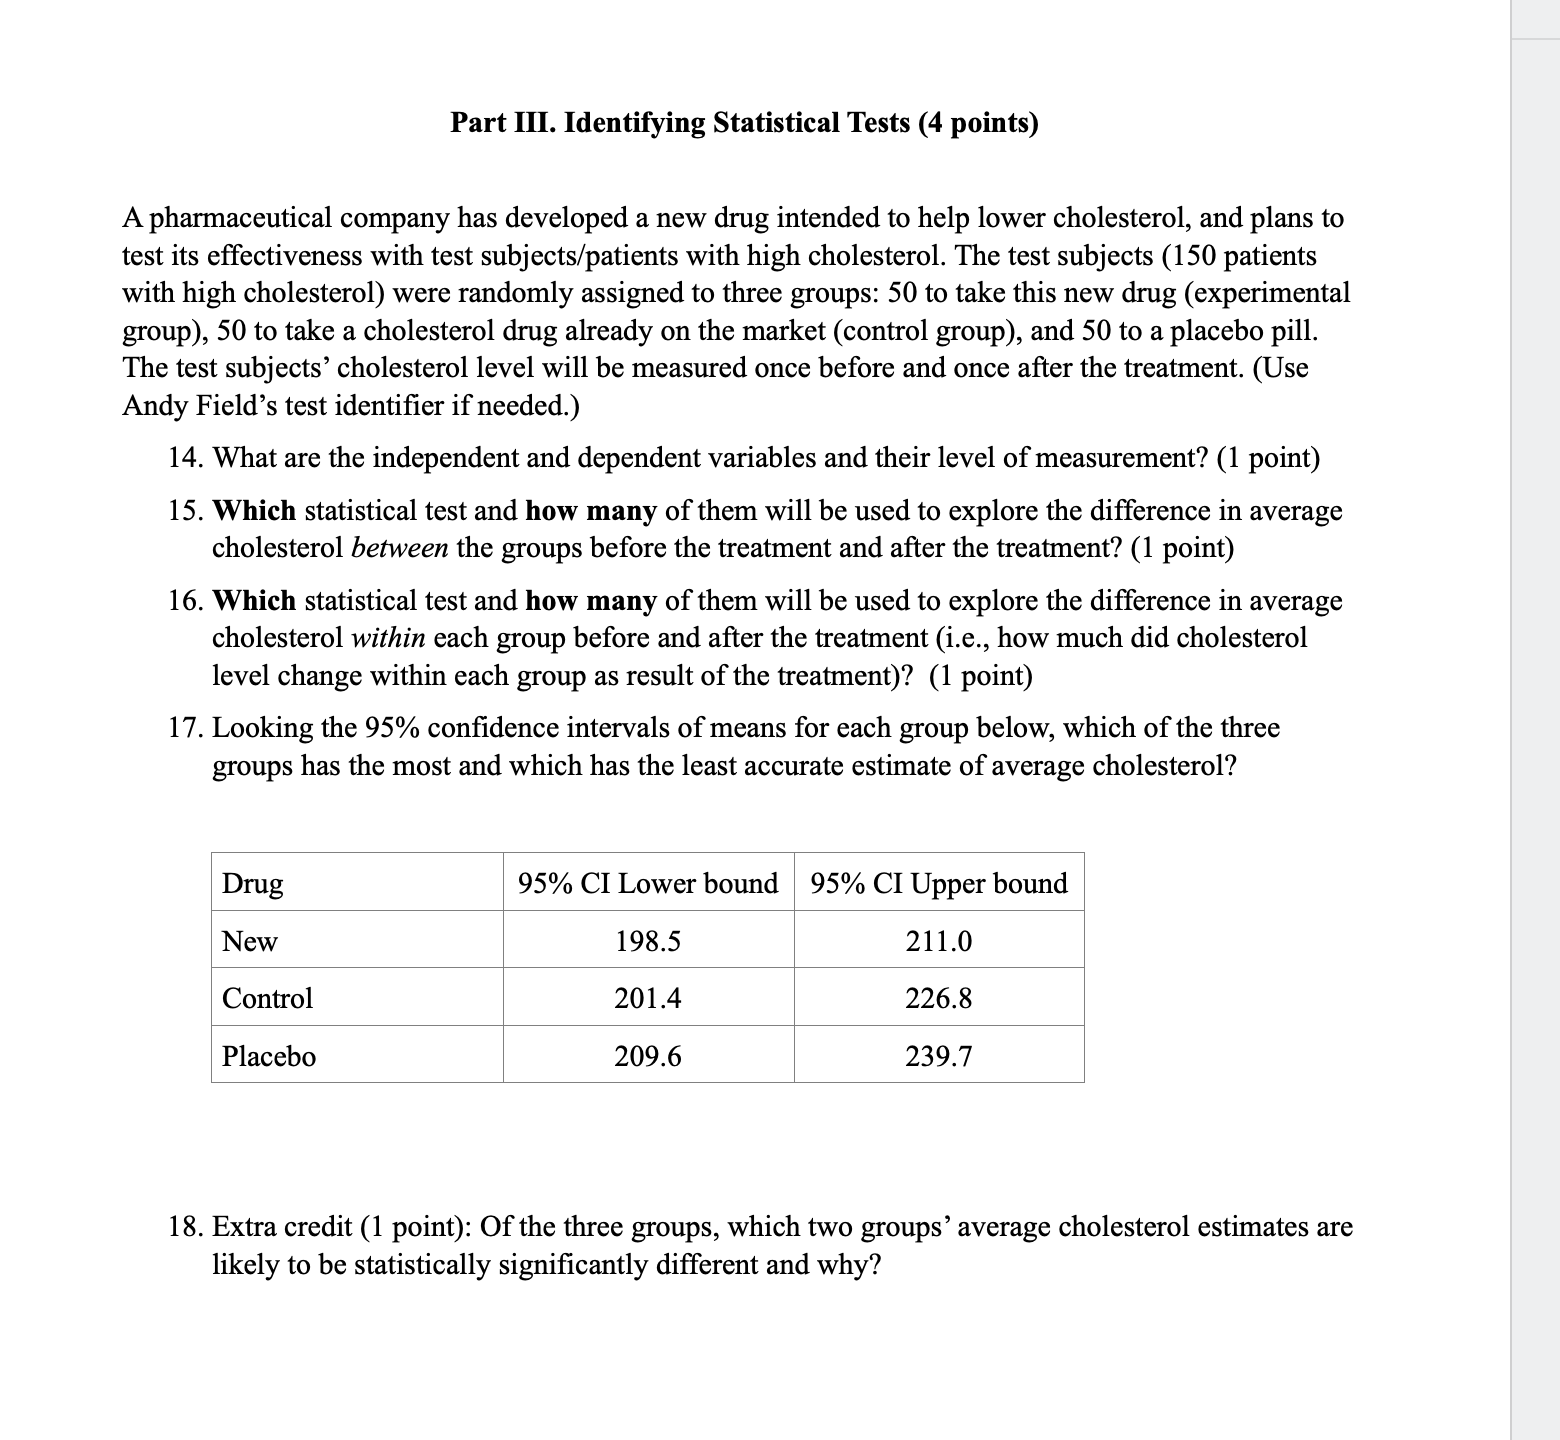
This final exam is composed of three parts. The first part consists of 10 items/questions based on a hypothetical data of Covid-19 patients admitted to hospital. The second part consists of 3 items/questions addressing standardized score, percentile ranking and score distributions. The third part consists of 3 items/questions where you will identify variables and statistical tests given the research scenario. Part 1. In the first part of this final exam, you will use a hypothetical dataset 'Anti-inflammation drug and Covid-19 trial data.xlsx', comparing the effectiveness of three anti-inflammation drugs/treatments in helping patients recover from Covid-19 (i.e., how long it takes to recover and be discharged from the hospital). Recovery is operationalized as length of stay in the hospital or number of days until discharged from the hospital. In other words, we want to see which of these three drugs/ treatments help patients recover fastest from Covid-19 using length of hospital stay as a proxy for their effectiveness. (As we witnessed, hospitals were overwhelmed with Covid-19 patients and speedy recovery and discharge was critical.) The independent/predictor variable is the Treatment with three randomly assigned group of Covid-19 patients: Group #1 received the standard treatment that includes the drug Dexamethasone, Group #2 received treatment that includes the new The dependent/outcome variable is recovery time, i.e., number of days until discharged from the hospital. This dataset includes three additional variables that may make difference in recovery time regardless of drug/treatment subjects received: 1. Age(Age) 2. Sex (Sex) (1=Female, 2=Male) 3. Race/Ethnicity (1=Asian, 2=American Indian/Alaskan Native, 3=Black/African American, 4=Hispanic, 5=Native Hawaiian, 6=White, 7=Mixed race) Orientation and General Instruction: Please differentiate your answers/responses in some way. You can use boldface, use different color text, or highlight your answers. In this hypothetical dataset, the variable Days to discharge has 61 subjects/cases with missing data. These cases are assumed to be deceased from Covid-19. 1-5. Create bar charts for each categorical variable. Create histograms and descriptive tables (includes measures of central tendency, measures of variation/spread-outness, and skewness and kurtosis) for each continuous variable. Copy and paste all bar charts, histograms, and descriptive tables onto the answer sheet. Please do NOT include any Frequency Distribution Table for any variable. Then describe trends, patterns, and exceptions present in the data for each variable. (5 points) 6 - 9. Given the research questions below, state the independent and dependent variables (or Variable 1 and Variable 2) and level of measurement. Write null and research/alternative hypotheses. Then conduct the appropriate statistical analysis. State tests used, report and interpret key statistics, and explain your findings, including the likelihood you might be committing Type I or II error given your decision regarding the null hypothesis. Refer back to your Assignments and Handouts in thoroughly addressing all elements in your reporting, interpretation, and conclusion. Be sure to add a conclusion in lay language. Conclusion is the most important aspect of items 6-9, worth ' of the points associated with each of these items. Do NOT include tables and graphs from SPSS output Just report and interpret your findings, and write a thorough summary and conclusion. Please use .01 as your threshold in determining statistical significance for items #6 to #9. Copy and paste each univariate graphs and descriptive tables under each variable listed below. Then describe trends, patterns and exceptions depicted in each graph and/or table. (5 points) 1. Treatment 2. Age 3. Sex 4. Race/Ethnicity 5. Recovery time/Days to discharge from the hospital 6. How effective are three drugs/treatments in treating inflammation, therefore helping them recover from Covid-19? In other words, which drug/treatment group take longest and shortest to discharge from the hospital? (Is there a statistically significant difference in number of days Covid-19 patients take to discharge from the hospital based on drugs/treatments? If so, how do they differ and by how much do they differ?) (4 points) Independent variable: Dependent variable: Ho: Hi: Statistical analysis used: Key statistics: Assumptions: Accept or reject the Ho: Summary and conclusion: Given your decision to accept or reject the Ho, which of the two errors are you likely to be committing, and why? 7. How and how well age of patients predict discharge from the hospital? (Is there is a statistically significant relationship between age and days to discharge? If so, what is the nature and degree of relationship?) (4 points) Variable 1: Variable 2: Ho: Hi: Statistical analysis used: Key statistics: Assumptions: Accept or reject the Ho: Summary and conclusion: Given your decision to accept or reject the Ho, which of the two errors are you likely to be committing, and why? 8. Do male and female patients differ in how long they take to discharge from the hospital? If so, how do they differ and by how much do they differ? (Is there a statistically significant difference in days to discharge between male and female patients?) (4 points) Independent variable: Statistics FINAL EXAM Name Dependent variable: Ho: Hi: Statistical analysis used: Key statistics: Assumptions: Accept or reject the Ho: Summary and conclusion: Given your decision to accept or reject the Ho, which of the two errors are you likely to be committing, and why? 9. Do patients differ in days to discharge from the hospital based on their race and ethnic background? If so, how do they differ and by how much do they differ? (Is there a statistically significant difference in days to discharge between patients from various race and ethnic group?) (4 points) Independent variable: Dependent variable: Ho: HI: Statistical analysis used: Key statistics: Assumptions: Accept or reject the Ho: Summary and conclusion: Given your decision to accept or reject the Ho, which of the two errors are you likely to be committing, and why? 10. What are your overall findings and conclusions from #6, #7, #8 and #9? (1point extra credit)Part II. Standardized score, percentile ranking and score distributions (5 points) Obtain your current grade in this class and calculate/find out your percentile ranking. You will need to convert your grade to z-score in order to find out your percentile ranking. Currently, the average grade for this class is 88.4 and the standard deviation is 4.52. Please show your work/calculation steps. well as in z-score form. (1 point) 12. Assuming normal distribution, please calculate/find out your percentile ranking in this class, and explain what your percentile ranking represent/mean in relation to your peers. (2 points) 13. If our class grade scores had skewness of -2.05, and kurtosis of 3.02. Is this a normal distribution? If so, please explain why. If not, how would you characterize this distribution relative to normal distribution? (2 points) Part I1I. Identifying Statistical Tests (4 points) A pharmaceutical company has developed a new drug intended to help lower cholesterol, and plans to test its effectiveness with test subjects/patients with high cholesterol. The test subjects (150 patients with high cholesterol) were randomly assigned to three groups: 50 to take this new drug (experimental group), 50 to take a cholesterol drug already on the market (control group), and 50 to a placebo pill. The test subjects' cholesterol level will be measured once before and once after the treatment. (Use Andy Field's test identifier if needed.) 14. What are the independent and dependent variables and their level of measurement? (1 point) 15. Which statistical test and how many of them will be used to explore the difference in average cholesterol between the groups before the treatment and after the treatment? (1 point) 16. Which statistical test and how many of them will be used to explore the difference in average cholesterol within each group before and after the treatment (i.e., how much did cholesterol level change within each group as result of the treatment)? (1 point) 17. Looking the 95% confidence intervals of means for each group below, which of the three groups has the most and which has the least accurate estimate of average cholesterol? Drug 95% CI Lower bound = 95% CI Upper bound New 198.5 211.0 Control 201.4 226.8 Placebo 209.6 239.7 18. Extra credit (1 point): Of the three groups, which two groups' average cholesterol estimates are likely to be statistically significantly different and why
Step by Step Solution
There are 3 Steps involved in it
Step: 1
Get Instant Access to Expert-Tailored Solutions
See step-by-step solutions with expert insights and AI powered tools for academic success
Step: 2
Step: 3
Ace Your Homework with AI
Get the answers you need in no time with our AI-driven, step-by-step assistance