

Answered step by step
Verified Expert Solution
Question
1 Approved Answer
This graph shows the results of a study about how people of different ages use national TV as a source of news. Percentage by
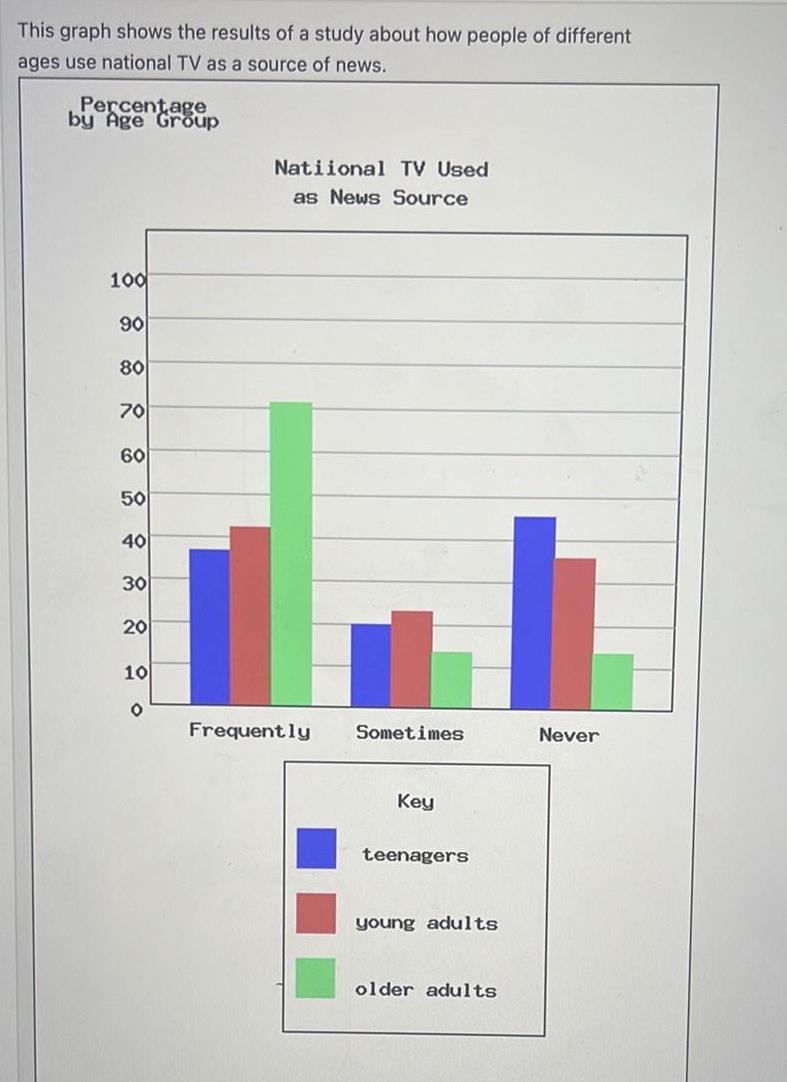
This graph shows the results of a study about how people of different ages use national TV as a source of news. Percentage by Age Group 100 90 80 Natiional TV Used as News Source 70 60 50 40 30 20 10 Frequently Sometimes Never Key teenagers young adults older adults
Step by Step Solution
There are 3 Steps involved in it
Step: 1

Get Instant Access to Expert-Tailored Solutions
See step-by-step solutions with expert insights and AI powered tools for academic success
Step: 2

Step: 3
Ace Your Homework with AI
Get the answers you need in no time with our AI-driven, step-by-step assistance
Get Started
Quantitative Methods For Business Management And Finance
Authors: Louise Swift, Sally Piff
2nd Edition
1403935289, 9781403935281