Answered step by step
Verified Expert Solution
Question
1 Approved Answer
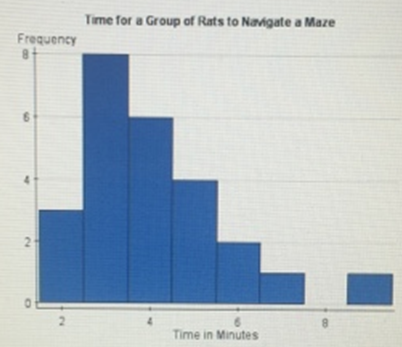
This histogram shows the times, in minutes, required for 25 rats in an animal behavior experiment to successfully navigate a maze. Which of the following
This histogram shows the times, in minutes, required for 25 rats in an animal behavior experiment to successfully navigate a maze.
 Which of the following best describes the shape of the histogram?
A. Symmetric
B. Left-skewed with no out ken
C. Right-skewed with no outliers
D. Left-skewed with a possible outlier
E. Right-skewed with a possible outlier
Frequency 8+ 2 0 Time for a Group of Rats to Navigate a Maze Time in Minutes
Step by Step Solution
★★★★★
3.30 Rating (159 Votes )
There are 3 Steps involved in it
Step: 1
We observe the histogram which show that shape of ...
Get Instant Access to Expert-Tailored Solutions
See step-by-step solutions with expert insights and AI powered tools for academic success
Step: 2

Step: 3

Ace Your Homework with AI
Get the answers you need in no time with our AI-driven, step-by-step assistance
Get Started


