

Answered step by step
Verified Expert Solution
Question
1 Approved Answer
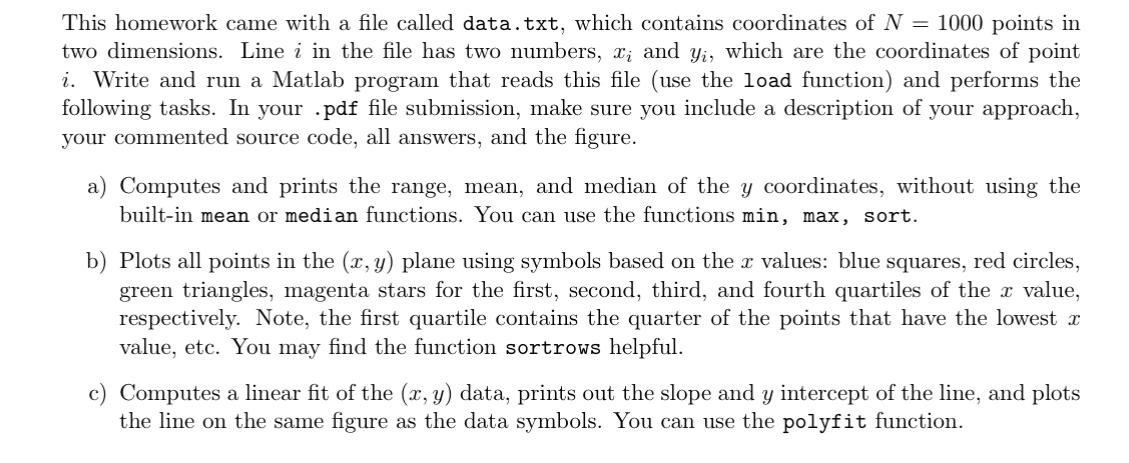
This homework came with a file called data.txt , which contains coordinates of N = 1 0 0 0 points in two dimensions. Line i
This homework came with a file called data.txt which contains coordinates of points in two dimensions. Line in the file has two numbers, and which are the coordinates of point i Write and run a Matlab program that reads this file use the load function and performs the following tasks. In your pdf file submission, make sure you include a description of your approach, your commented source code, all answers, and the figure.
a Computes and prints the range, mean, and median of the coordinates, without using the builtin mean or median functions. You can use the functions min, max, sort.
b Plots all points in the plane using symbols based on the values: blue squares, red circles, green triangles, magenta stars for the first, second, third, and fourth quartiles of the value, respectively. Note, the first quartile contains the quarter of the points that have the lowest value, etc. You may find the function sortrows helpful.
c Computes a linear fit of the data, prints out the slope and intercept of the line, and plots the line on the same figure as the data symbols. You can use the polyfit function.
Step by Step Solution
There are 3 Steps involved in it
Step: 1

Get Instant Access to Expert-Tailored Solutions
See step-by-step solutions with expert insights and AI powered tools for academic success
Step: 2

Step: 3
Ace Your Homework with AI
Get the answers you need in no time with our AI-driven, step-by-step assistance
Get Started
Focus On Geodatabases In ArcGIS Pro
Authors: David W. Allen
1st Edition
1589484452, 978-1589484450