Answered step by step
Verified Expert Solution
Question
1 Approved Answer
FINC6610- Capital Market Theory Homework on SIM and Multi-Index Model Instructions: This homework is about testing the contribution of multi-index model over the single

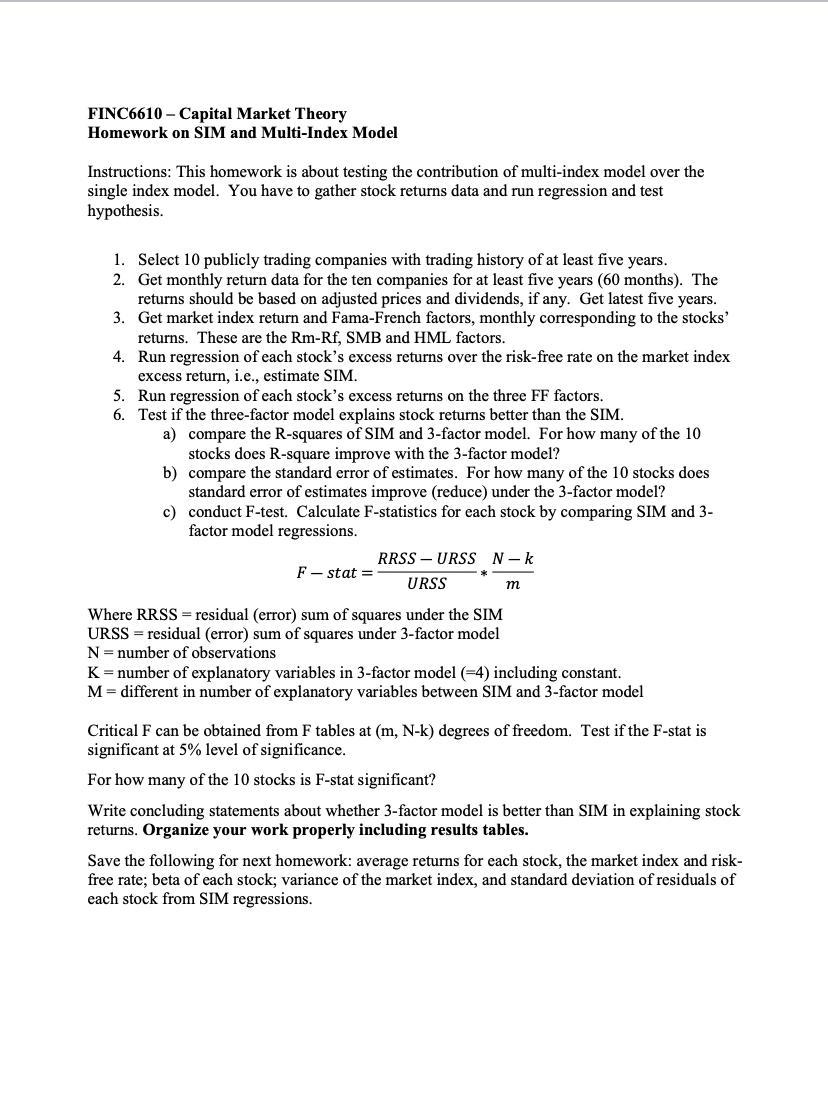
FINC6610- Capital Market Theory Homework on SIM and Multi-Index Model Instructions: This homework is about testing the contribution of multi-index model over the single index model. You have to gather stock returns data and run regression and test hypothesis. 1. Select 10 publicly trading companies with trading history of at least five years. 2. Get monthly return data for the ten companies at least five years (60 months). The returns should be based on adjusted prices and dividends, if any. Get latest five years. Get market index return and Fama-French factors, monthly corresponding to the stocks' returns. These are the Rm-Rf, SMB and HML factors. 3. 4. Run regression of each stock's excess returns over the risk-free rate on the market index excess return, i.e., estimate SIM. 5. Run regression of each stock's excess returns on the three FF factors. 6. Test if the three-factor model explains stock returns better than the SIM. a) compare the R-squares of SIM and 3-factor model. For how many of the 10 stocks does R-square improve with the 3-factor model? b) compare the standard error of estimates. For how many of the 10 stocks does standard error of estimates improve (reduce) under the 3-factor model? c) conduct F-test. Calculate F-statistics for each stock by comparing SIM and 3- factor model regressions. F-stat = RRSS URSS N-k URSS Where RRSS = residual (error) sum of squares under the SIM URSS = residual (error) sum of squares under 3-factor model N = number of observations m K = number of explanatory variables in 3-factor model (-4) including constant. M = different in number of explanatory variables between SIM and 3-factor model Critical F can be obtained from F tables at (m, N-k) degrees of freedom. Test if the F-stat is significant at 5% level of significance. For how many of the 10 stocks is F-stat significant? Write concluding statements about whether 3-factor model is better than SIM in explaining stock returns. Organize your work properly including results tables. Save the following for next homework: average returns for each stock, the market index and risk- free rate; beta of each stock; variance of the market index, and standard deviation of residuals of each stock from SIM regressions.
Step by Step Solution
★★★★★
3.42 Rating (165 Votes )
There are 3 Steps involved in it
Step: 1
Testing the Contribution of MultiIndex Model over the Single Index Model Step 1 Select 10 publicly trading companies with trading history of at least five years Step 2 Get monthly return data for the ...
Get Instant Access to Expert-Tailored Solutions
See step-by-step solutions with expert insights and AI powered tools for academic success
Step: 2

Step: 3

Ace Your Homework with AI
Get the answers you need in no time with our AI-driven, step-by-step assistance
Get Started


