

Question
THIS IS A PROJECT. I NEED THE COMPARISON FOR BOTH MALES AND FEMALES. ALL THE INSTRUCTIONS HAVE TO FOLLOWED THANKS In an article in the
THIS IS A PROJECT. I NEED THE COMPARISON FOR BOTH MALES AND FEMALES. ALL THE INSTRUCTIONS HAVE TO FOLLOWED THANKS
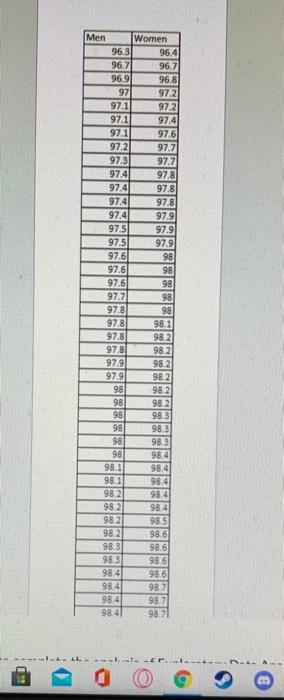
In an article in the Journal of Statistics Education (vol. , no 2), Allen Shoemaker describes a study that was reported in the Journal of American Medical Association (JAMA). It is generally accepted that the mean temperature of an adult human is 98.6F. In his article, Shoemaker uses the data from the JAMA article to test his hypothesis. The data for the JAMA article were collected from healthy men and women, ages 18 to 40, at the University of Maryland Center for Vaccine Development, Baltimore. [Elementary Statistics: Picturing the World by Ron Larson and Betsy Farber 7th Ed.]
- Data:Click on "StatCrunch" on MyLab Statistics, then "Data sets from the textbook". Scroll down to Chapter 7, then click on Chapter 7: Case Study: Human Body Temperature: What's Normal?
Do all of the work below with the"Men" data setdownload
Minimize File Preview
- .Use a statistical software package to complete the analysis of Exploratory Data Analysis and Inferential Statistics. You are strongly encouraged to use StatCrunch (in MyLab Statistics).You may also use any other software packages (s.a. MINITAB, or SPSS). However, if you use other software, you are on your own, for your instructor will only help with question with regards to StatCrunch.
A) Exploratory Data Analysis
- Construct a stem and leaf display.
- Construct a histogram.
- Construct a boxplot and use it to investigate the data for outliers.
- Obtain the sample mean, median, mode, and standard deviation.
B) Inferential Statistics
- Construct a normal probability plot or quantile-quantile (QQ) plotto assess normality. Use this assessment to determine which tests are appropriate for these data for confidence interval and test of hypothesis as you will use these procedures for parts 2 and 3 below.
- Construct a 99% confidence interval for , for mean body temperature for all adult males in the population.
- At the 1% significance level, do the data provide sufficient evidence to conclude that the mean body temperature of men is 98.6F?
- Using the software output, perform the confidence interval and the full hypothesis test.
- Write a summary and findings of the project
C) Write-up
- Write a brief introduction of the project.
- Interpret the mean, and standard deviation in context of the data given.
- Compare the measures of center and comment on which measure of center would best describe the data given.
- Comment on the shape of the distribution.
- Are there any outliers in the data? Include results of your investigation for outliers.
- Comment on your assessment of normality.
- Which test will be most appropriate for the inferential statistics? Z-test or t-test? Why?
- Write an interpretation for the confidence interval estimate in context of the data.
- State the hypothesis
- State the conclusion and summary of the significance test and interpret the p-value using the context of the data.
- Compare the results from the confidence interval and the significance test. Are they the same? Why do think this is the case?
- Submit your projectas an attachment via the link above using the following format in a Microsoft Word or pdf document
- First page - Title page including your name, course number, and section number
- Second page - Write - up (See Part C)
- Final pages - Statistical Software Output and Additional Work (See Parts A and B)
data set:
Step by Step Solution
There are 3 Steps involved in it
Step: 1

Get Instant Access to Expert-Tailored Solutions
See step-by-step solutions with expert insights and AI powered tools for academic success
Step: 2

Step: 3
Ace Your Homework with AI
Get the answers you need in no time with our AI-driven, step-by-step assistance
Get Started
A First Course In Discrete Mathematics
Authors: John C Molluzzo, Fred Buckley
1st Edition
1478634383, 9781478634386