

Answered step by step
Verified Expert Solution
Question
1 Approved Answer
This is a US interest rate(fed fund rate)in US between 2008-2018, explain each trend on the graph(why it happened). Dont copy from others or google.
This is a US interest rate(fed fund rate)in US between 2008-2018, explain each trend on the graph(why it happened). Dont copy from others or google.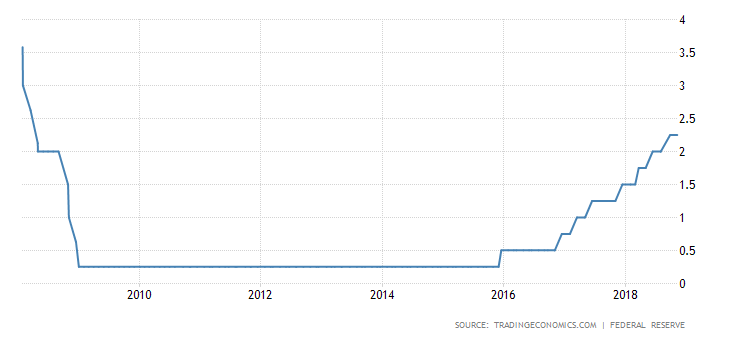
Step by Step Solution
There are 3 Steps involved in it
Step: 1

Get Instant Access to Expert-Tailored Solutions
See step-by-step solutions with expert insights and AI powered tools for academic success
Step: 2

Step: 3
Ace Your Homework with AI
Get the answers you need in no time with our AI-driven, step-by-step assistance
Get Started
Finance For Freelancers Financial Intelligence
Authors: Andrew Holmes
1st Edition
1408101165, 978-1408101162