This is all info i have no more info can be giving! A random sample of 41 adult coyotes in a region of northern Minnesota
This is all info i have no more info can be giving!
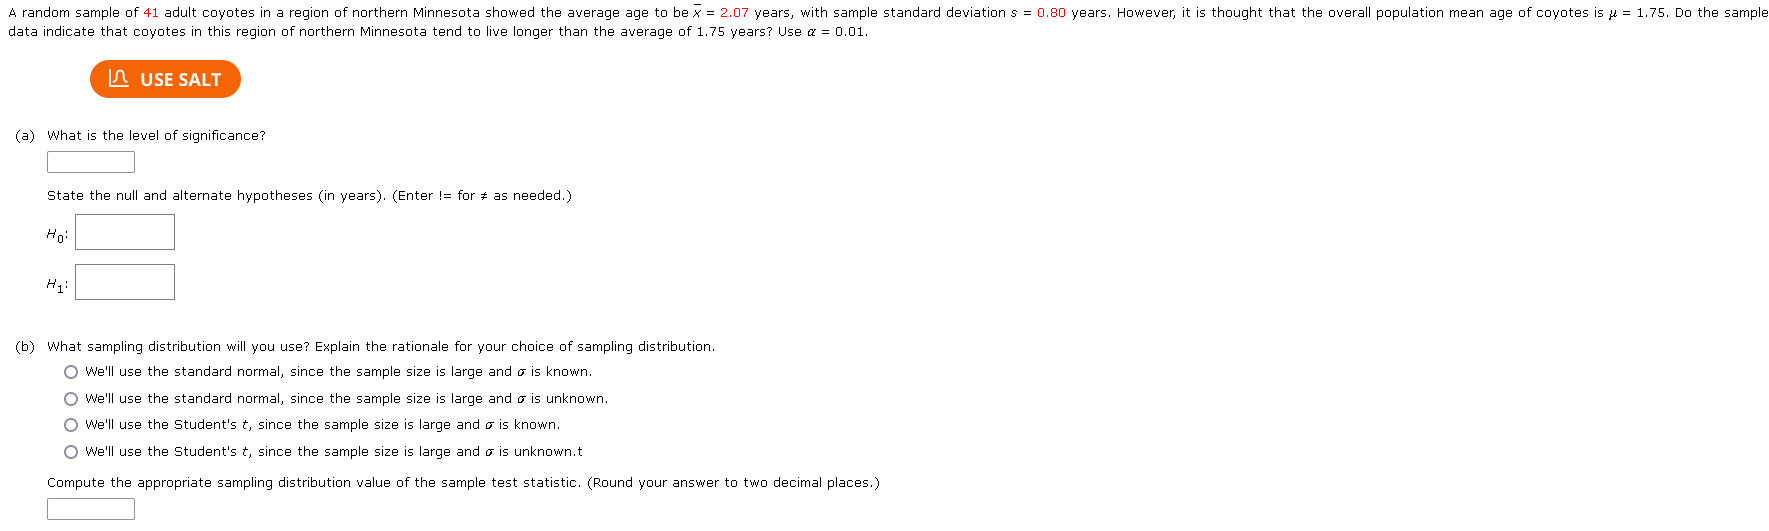
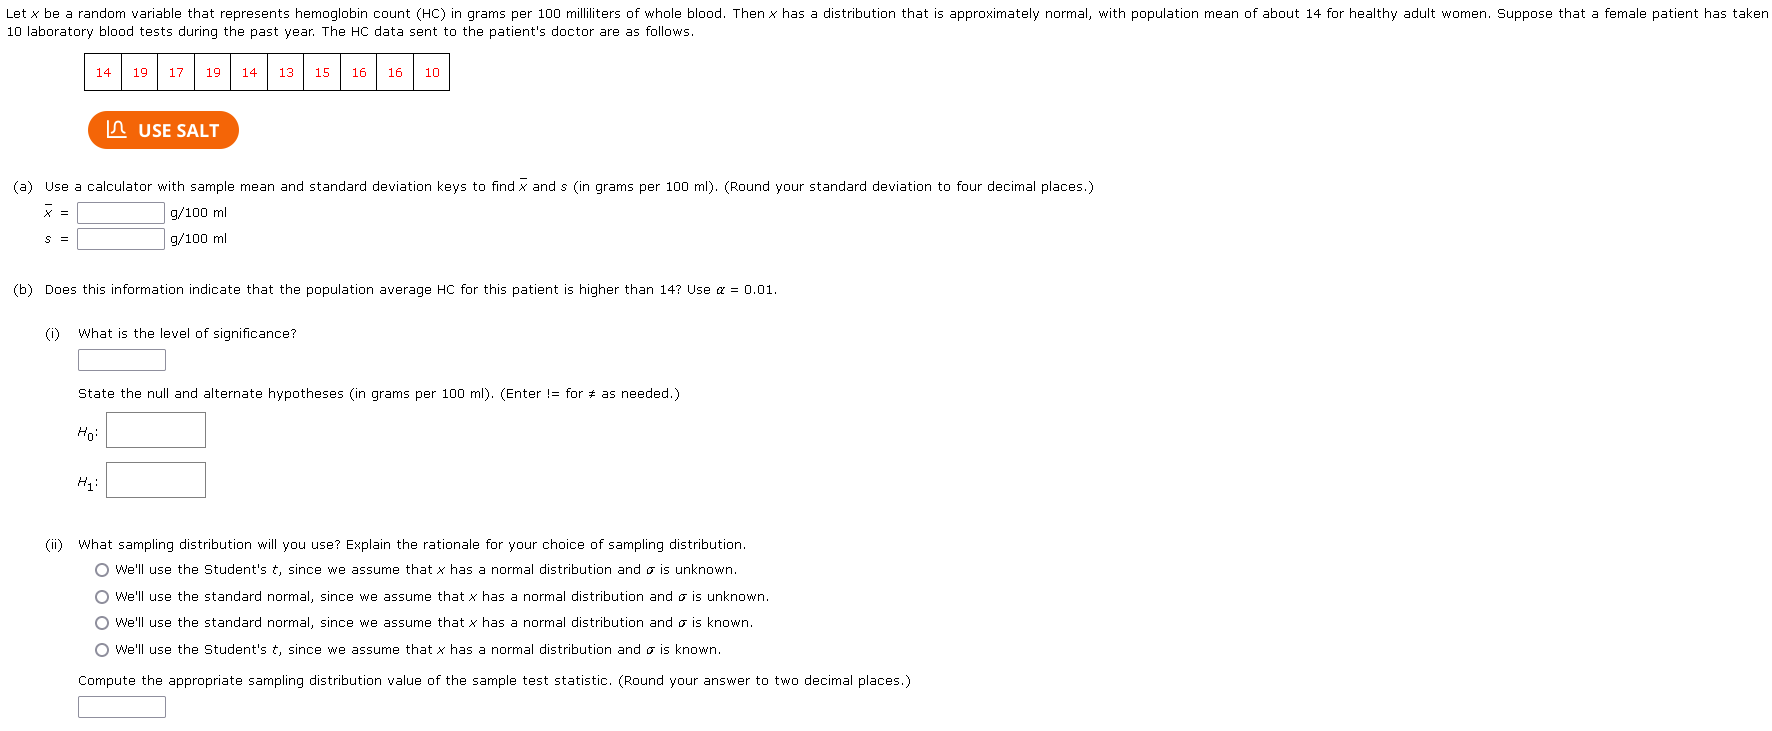
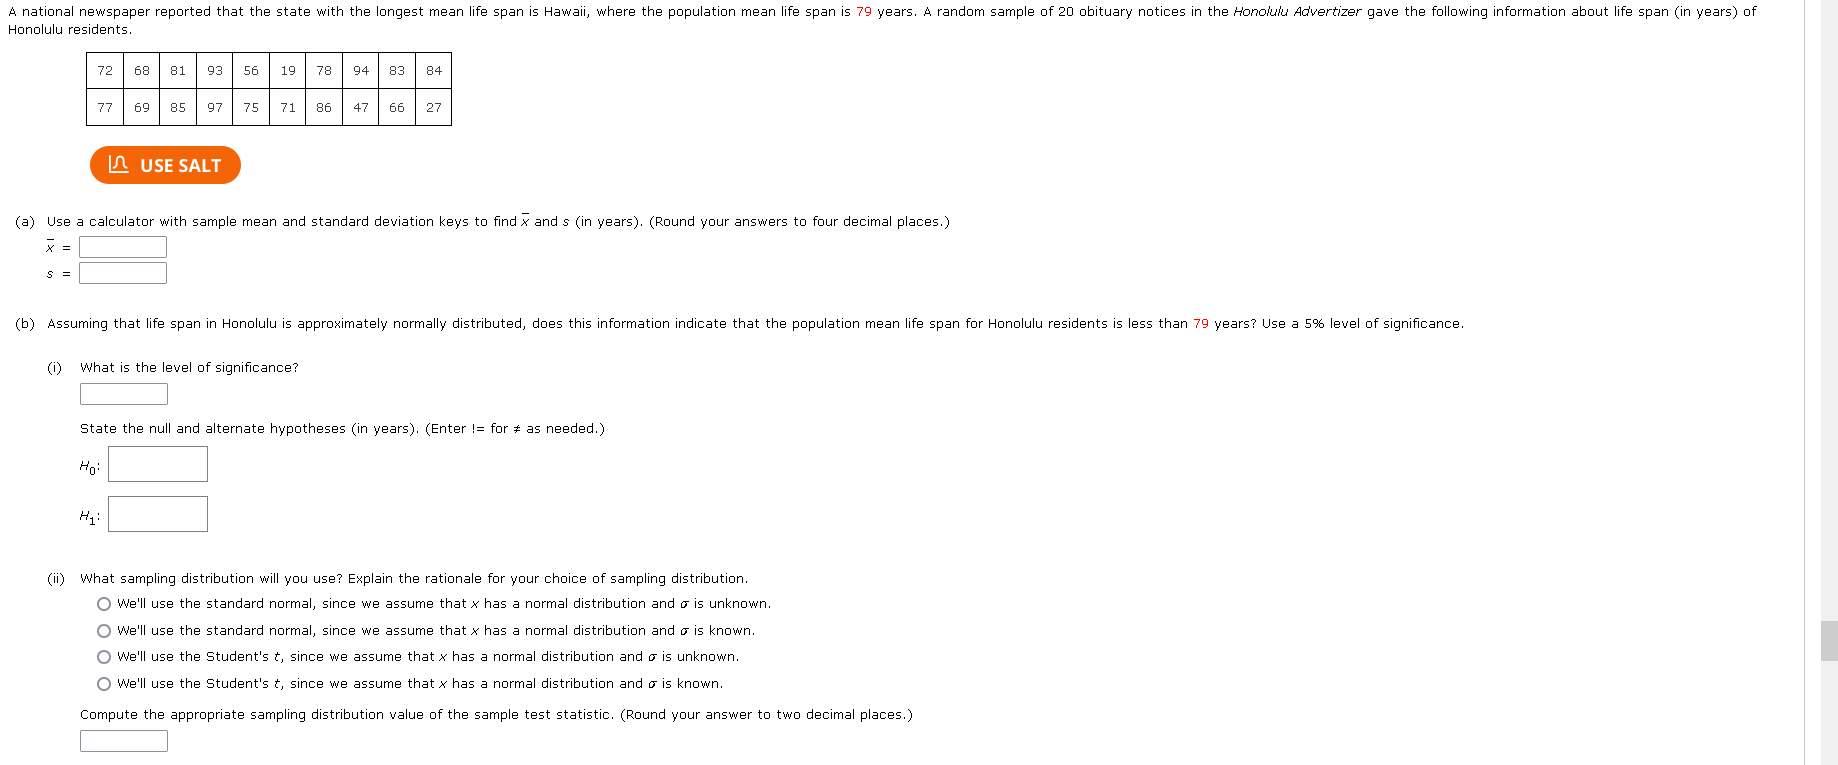
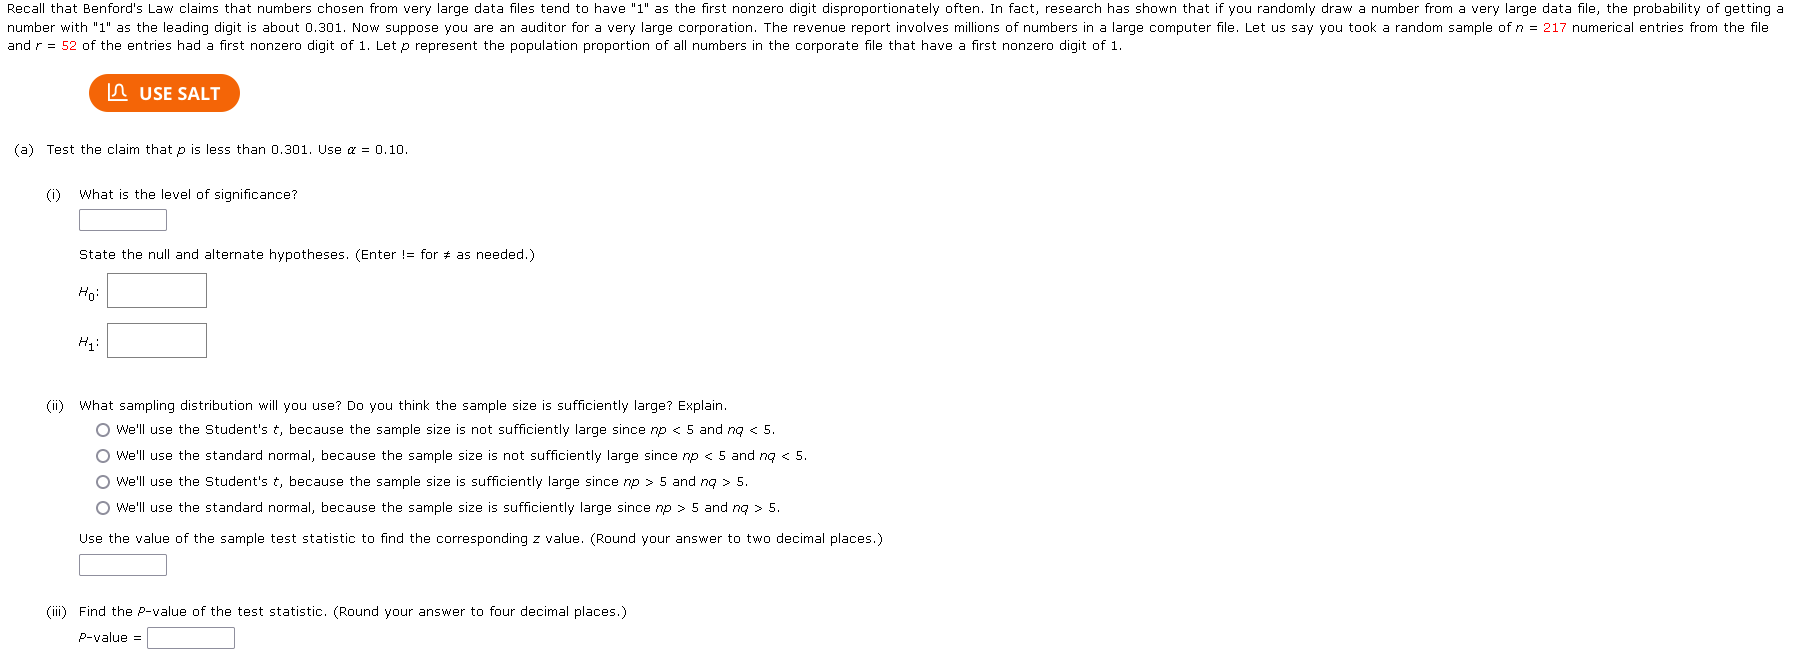
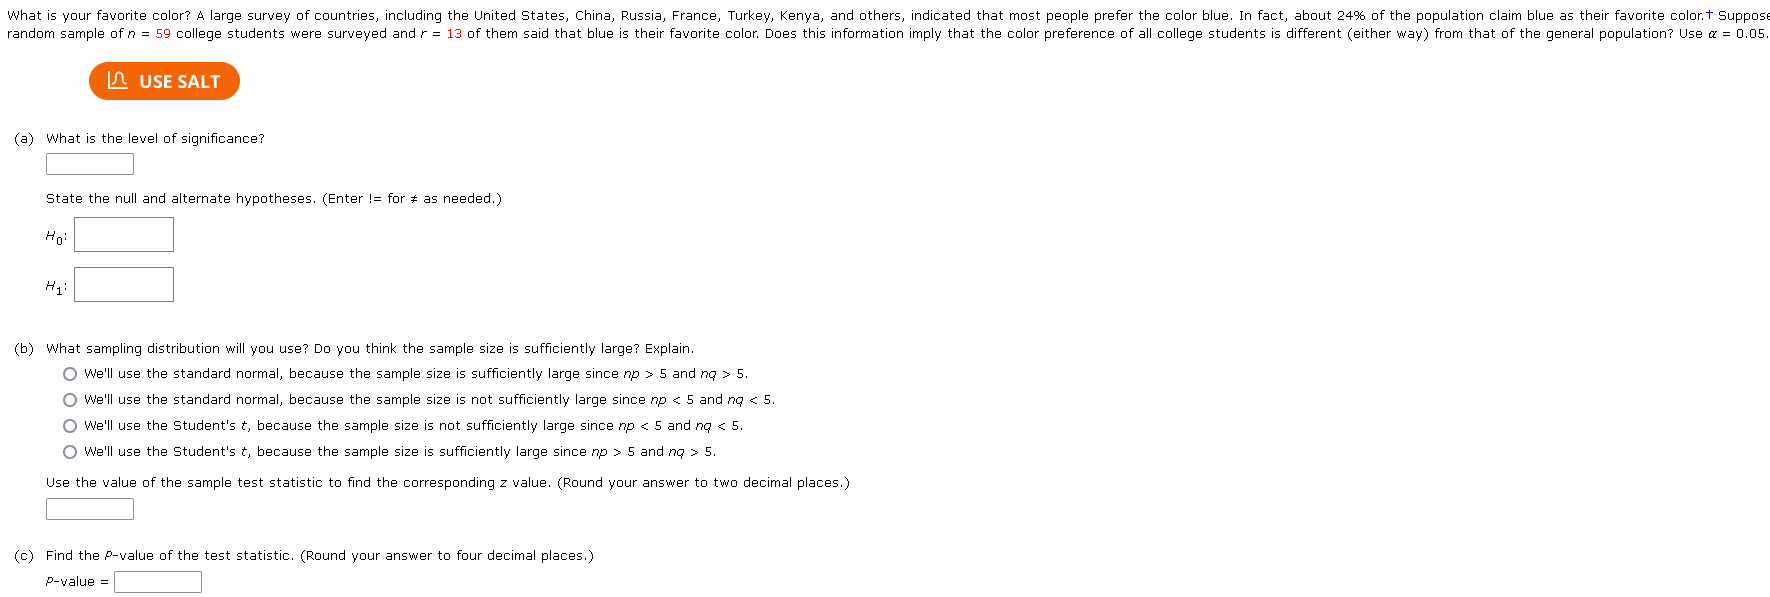
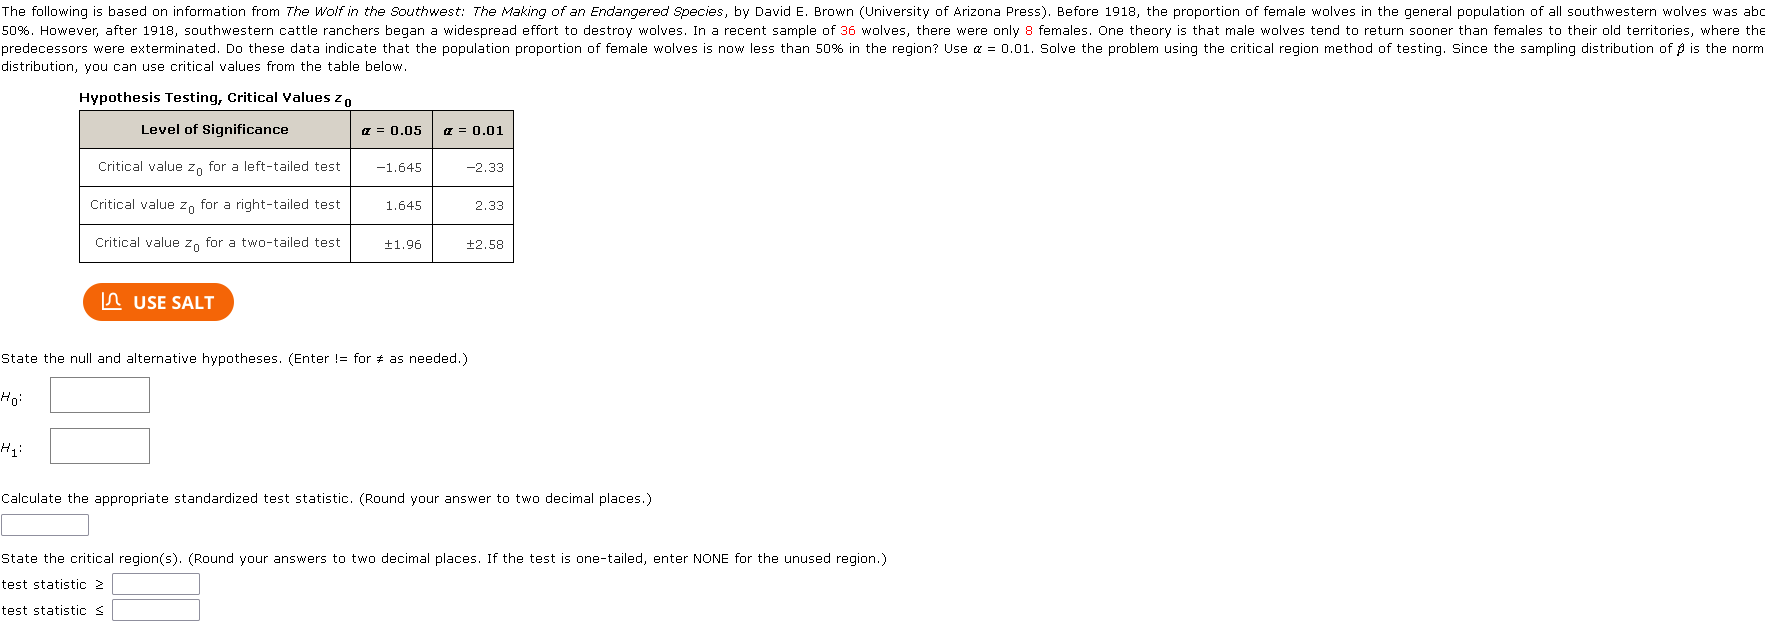
A random sample of 41 adult coyotes in a region of northern Minnesota showed the average age to be x = 2.07 years, with sample standard deviation s = 0.80 years. However, it is thought that the overall population mean age of coyotes is / = 1.75. Do the sample data indicate that coyotes in this region of northern Minnesota tend to live longer than the average of 1.75 years? Use a = 0.01. LA USE SALT (a) What is the level of significance? State the null and alternate hypotheses (in years). (Enter != for = as needed.) Ho: H1: (b) What sampling distribution will you use? Explain the rationale for your choice of sampling distribution. O We'll use the standard normal, since the sample size is large and o is known. O We'll use the standard normal, since the sample size is large and o is unknown. O We'll use the Student's t, since the sample size is large and o is known. O we'll use the Student's &, since the sample size is large and o is unknown.t Compute the appropriate sampling distribution value of the sample test statistic. (Round your answer to two decimal places.)Let be a random variable that represents hemaglobin count (HC) in grams per 108 millliters of whole bland. Then x has a distribution that is approximately normal, with population mean of about 14 for healthy adult women. Suppose that a female patient has taken 10 laboratory blood tests during the past year The HC data sent to the patient's doctor are as follows, 14 | 19 | 17 [ 18 ) 14 | 13 | 15 | 16 | 16 [ 10 AT XY (a) Use a calculator with sample mean and standard deviation keys to find x and s (in grams per 100 ml), (Round your standard deviation to four decimal places.) X = 9/100 ml s = /100 ml (b} Does this information indicate that the population average HC far this patient is higher than 142 Use & = 0.01 (i) What is the level of significance? State the null and alternate hypotheses in grams per 100 ml). (Enter != for # as nesded.) (i) What sampling distribution will you use? Explain the rationale for your choice of sampling distribution we'll use the Student's , since we assume that x has a narmal distribution and & is unknown. we'll use the standard normal, since we assume that x has a normal distribution and o is unknown we'll use the standard normal, since we assume that x has a normal distribution and o is known wie'll use the Student's , since we assume that x has a normal distribution and & is known Compute the appropriate sampling distribution value of the sample test statistic. (Round your answer to two decimal places.) 4 national newspaper reported that the state with the longest mean life span is Hawaii, where the population mean life span is 73 years. 4 random sample of 20 obituary notices in the Honokiu Advertizer gave the following information about life span (in years) of Honolulu residents T2 | 62|81 |02 | 56 | 10| 78 | 94| B3 | 84 77 | 63|85 |97 | 75| 71|86 |47 |66 |27 I USE sAl () Use a calculator with sample mean and standard deviation keys to find and s {in years). (Round your answers to four decimal places. ) X = 5 (b} Assuming that life span in Homelulu is approximately normally distributed, does this information indicate that the population mean life span for Honolulu residents is less than 79 years? Use a 5% level of significance. (i) what is the level of significance? State the null and alternate hypotheses {in years). (Enter |= for # as needed.) (iiy what sampling distribution will you use? Explain the ratiohale for your choice of sampling distribution we'll use the standard normal, since we assume that x has a normal distribution and & is unknown. we'll use the standard normal, since we assume that x has a normal distribution and & is known. we'll use the Student's , since we assume that x has 3 normal distribution and & is unknown we'll use the Student's , since we assume that x has a normal distribution and & is known Campute the sppropriate sampling distribution value of the sample test statistic. (Round your answer to two decimal places.) Recall that Benford's Law claims that numbers chosen from very large data files tend to have "1" as the first nonzero digit disproportionately often. In fact, research has shown that if you randomly draw a number from a very large data file, the probability of getting a number with "1" as the leading digit is about 0.301. Now suppose you are an auditor for a very large corporation. The revenue report involves millions of numbers in a large computer file. Let us say you took a random sample of n = 217 numerical entries from the file and r = 52 of the entries had a first nonzero digit of 1. Let p represent the population proportion of all numbers in the corporate file that have a first nonzero digit of 1. LA USE SALT (a) Test the claim that p is less than 0.301. Use a = 0.10. (i) What is the level of significance? State the null and alternate hypotheses. (Enter != for # as needed.) Ho H1 (ii) What sampling distribution will you use? Do you think the sample size is sufficiently large? Explain. O We'll use the Student's &, because the sample size is not sufficiently large since no 5 and no > 5. O We'll use the standard normal, because the sample size is sufficiently large since np > 5 and no > 5. Use the value of the sample test statistic to find the corresponding z value. (Round your answer to two decimal places.) (ii) Find the P-value of the test statistic. (Round your answer to four decimal places.) P-value =What is your favorite color? A large survey of countries, including the United States, China, Russia, France, Turkey, Kenya, and others, indicated that most people prefer the color blue. In fact, about 24% of the population claim blue as their favorite color. Suppose random sample of n = 59 college students were surveyed and / = 13 of them said that blue is their favorite color. Does this information imply that the color preference of all college students is different (either way) from that of the general population? Use a = 0.05. USE SALT (a) What is the level of significance? State the null and alternate hypotheses. (Enter != for * as needed. ) Ho (b) What sampling distribution will you use? Do you think the sample size is sufficiently large? Explain. O We'll use the standard normal, because the sample size is sufficiently large since np > 5 and nq > 5. O We'll use the standard normal, because the sample size is not sufficiently large since no 5 and no > 5. Use the value of the sample test statistic to find the corresponding z value. (Round your answer to two decimal places.) (c) Find the P-value of the test statistic. (Round your answer to four decimal places.) P-value =The following is based on information from The Wolf in the Southwest: The Making of an Endangered Species, by David E. Brown (University of Arizona Press). Before 1918, the proportion of female wolves in the general population of all southwestern wolves was abo 509%. However, after 1918, southwestern cattle ranchers began a widespread effort to destroy wolves. In a recent sample of 36 wolves, there were only 8 females. One theory is that male wolves tend to return sooner than females to their old territories, where the predecessors were exterminated. Do these data indicate that the population proportion of female wolves is now less than 509% in the region? Use a = 0.01. Solve the problem using the critical region method of testing. Since the sampling distribution of p is the norm distribution, you can use critical values from the table below. Hypothesis Testing, Critical Values zo Level of Significance 1 = 0.05 ( = 0.01 Critical value zo for a left-tailed test -1.645 -2.33 Critical value zo for a right-tailed test 1.645 2.33 Critical value Zo for a two-tailed test $1.96 $2.58 USE SALT State the null and alternative hypotheses. (Enter != for = as needed. ) Calculate the appropriate standardized test statistic. (Round your answer to two decimal places.) State the critical region(s). (Round your answers to two decimal places. If the test is one-tailed, enter NONE for the unused region.) test statistic 2 est statistic s
Step by Step Solution
There are 3 Steps involved in it
Step: 1
Get Instant Access to Expert-Tailored Solutions
See step-by-step solutions with expert insights and AI powered tools for academic success
Step: 2
Step: 3
Ace Your Homework with AI
Get the answers you need in no time with our AI-driven, step-by-step assistance