THIS IS ALL ONE QUESTION. please answer a-y.
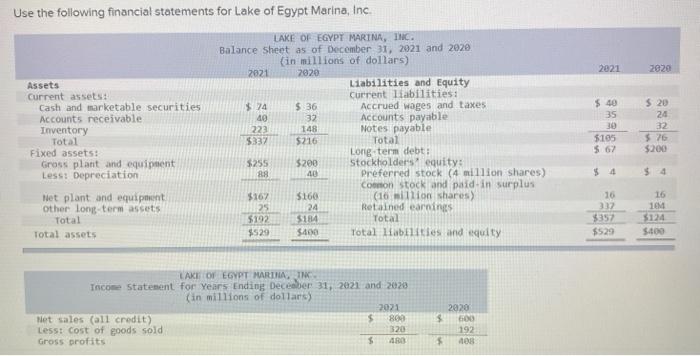
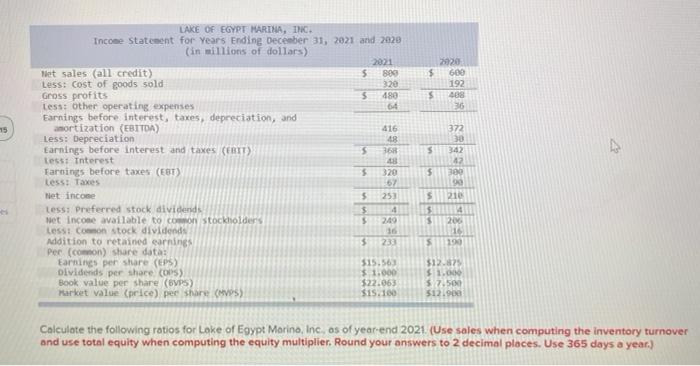
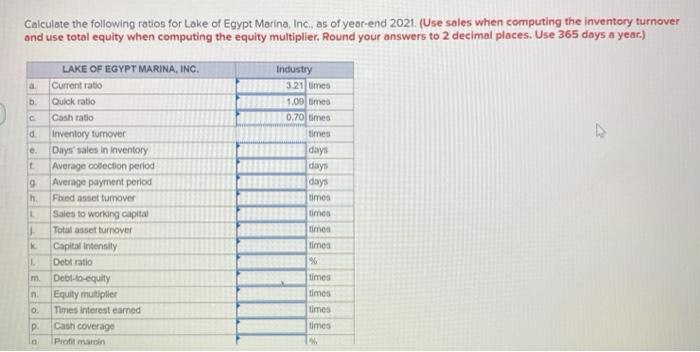
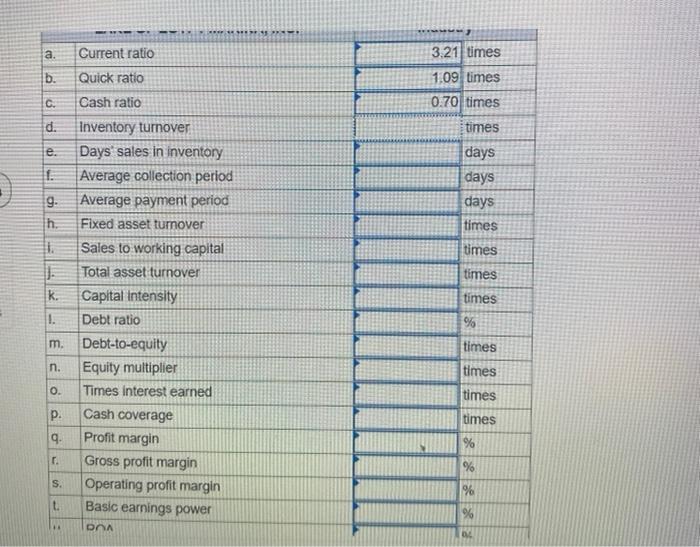
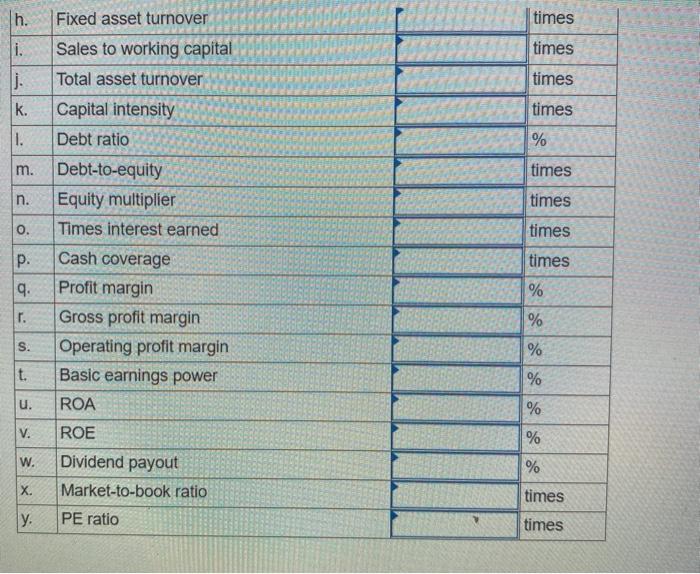
Use the following financial statements for Lake of Egypt Marina, Inc. 2021 2020 Assets Current assets: Cash and marketable securities Accounts receivable Inventory Total Fixed assets: Gross plant and equipment Less: Depreciation LAKE OF EGYPT MARINA, INC. Balance Sheet as of December 31, 2021 and 2020 (in millions of dollars) 2021 2020 Liabilities and Equity Current liabilities: $ 74 $36 Accrued wages and taxes 40 32 Accounts payable 223 148 Notes payable $337 $216 Total Long term debt: 5255 $200 Stockholder's equity: 88 40 Preferred stock (4 million shares) common stock and paid in surplus $160 (16 million shares) 25 24 Retained earnings 5192 $184 Total $529 $400 Total liabilities and equity $40 35 30 $105 5.67 $20 24 32 $76 $200 $167 Het plant and equipment other long-term assets Total Total assets 16 337 $357 $529 16 1M $124 LAKE OF EGYPT MARTHA, NO Income Statement for Years Ending December 31, 2021 and 2020 (in millions of dollars) 2021 Net sales (all credit) $ 800 Less: Cost of goods sold 320 Gross profits $ AR 2020 $ 600 192 $ 40 $ 2020 600 192 138 36 $ 15 372 A LAKE OF EGYPT MARINA, INC. Income statement for Years Ending December 31, 2021 and 2028 (in millions of dollars) 2021 Net sales (all credit) 5 800 Less: Cost of goods sold Gross profits $ 480 Less: Other operating expenses Earnings before interest, taxes, depreciation, and amortization (EBITDA) 416 Less: Depreciation 48 Earnings before interest and taxes (EBIT) 5 368 Less Interest Farnings before taxes (EST) 5 320 Less Taxes 67 Net income 5 253 Less: Preferred stock dividends 4 wet Income available to common stockholders $ Less: Coon stock dividends Addition to retained earnings $ 230 Per coon) share data Earnings per share (EPS) $15.563 Dividends per share (O) $ 1.000 Book value per Share (VPS) $22.063 Market value (price) per share (MS) $15.100 $ 342 42 $ 300 00 $ 210 15111 $ 200 16 5 190 22:00 $12.85 $ 1.000 $ 2.500 $12.90 Calculate the following ratios for Lake of Egypt Marino, Inc, as of year-end 2021. (Use sales when computing the inventory turnover and use total equity when computing the equity multiplier, Round your answers to 2 decimal places. Use 365 days a year.) Calculate the following ratios for Lake of Egypt Morina, Inc., as of year-end 2021. (Use sales when computing the inventory turnover and use total equity when computing the equity multiplier. Round your answers to 2 decimal places. Use 365 days a year.) a b. Ic d A e. LAKE OF EGYPT MARINA, INC. Current ratio Quick ratio Cash ratio Inventory turnover Days' sales in Inventory Average collection period Average payment period Fored asset turnover Sales to working capital Total asset turnover Capital Intensity Debt ratio Debt-to-equity Equity multiplier Times interest eamed Cash coverage Profit mari Industry 321 times 1.09 times 0.70 times times days days days times times times times % 9 m. times n 0. times times times . a. Current ratio b. Quick ratio 3.21 times 1.09 times 0.70 times C. d. times e. 11. 9. h. 1. days days days times times times is. k. times 1. Cash ratio Inventory turnover Days' sales in inventory Average collection period Average payment period Fixed asset turnover Sales to working capital Total asset turnover Capital Intensity Debt ratio Debt-to-equity Equity multiplier Times interest earned Cash coverage Profit margin Gross profit margin Operating profit margin Basic earnings power DOA m. % times times times n. 0. P. times 9. % . % S. %% L. % 18 h. Fixed asset turnover times i. times j. times k. times 1. % m. times n. times 0. times p. Sales to working capital Total asset turnover Capital intensity Debt ratio Debt-to-equity Equity multiplier Times interest earned Cash coverage Profit margin Gross profit margin Operating profit margin Basic earnings power ROA ROE Dividend payout Market-to-book ratio 9. times % % r. S. % t. % u. % V. % W. % times X y PE ratio times


