this is answer Q1. and the data for both alike.
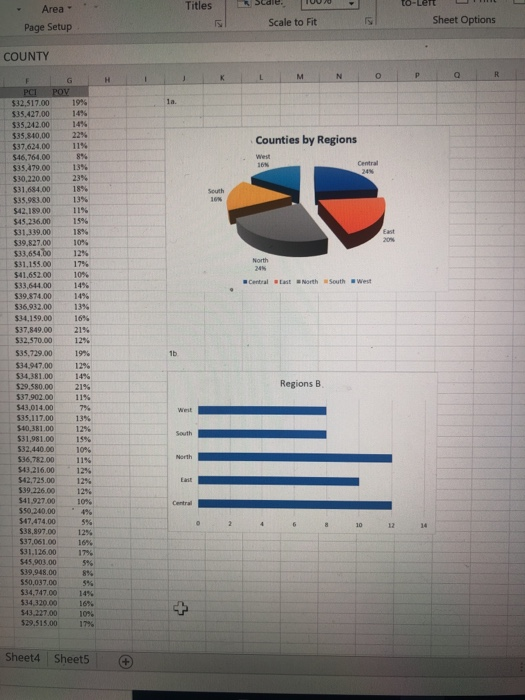
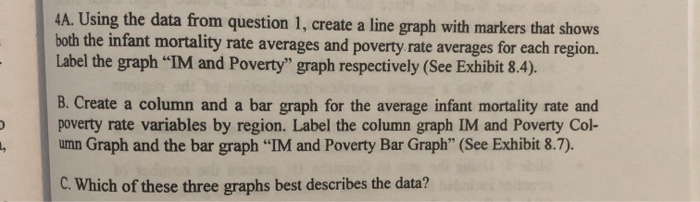
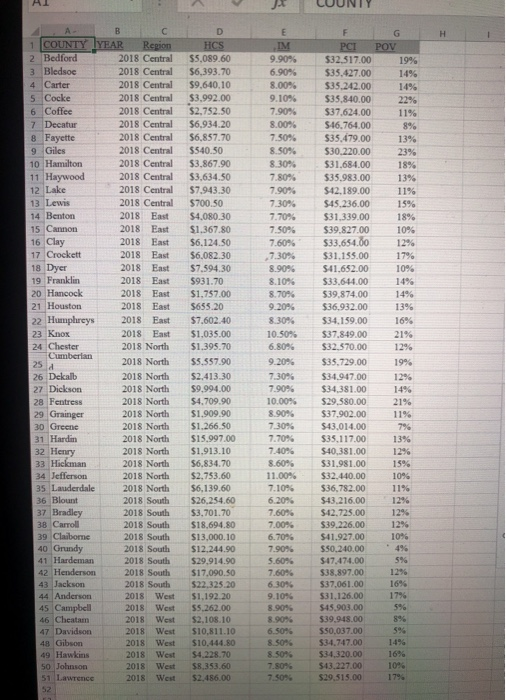
4A. Using the data from question 1, create a line graph with markers that shows both the infant mortality rate averages and poverty rate averages for each region. Label the graph IM and Poverty" graph respectively (See Exhibit 8.4). B. Create a column and a bar graph for the average infant mortality rate and poverty rate variables by region. Label the column graph IM and Poverty Col- umn Graph and the bar graph "IM and Poverty Bar Graph (See Exhibit 8.7). . C. Which of these three graphs best describes the data? HI 19% 12% B C 1 COUNTY YEAR Region 2 Bedford 2018 Central 3 Bledsoe 2018 Central 4 Carter 2018 Central 5 Cocke 2018 Central 6 Coffee 2018 Central 7 Decatur 2018 Central 8 Fayette 2018 Central 9 Giles 2018 Central 10 Hamilton 2018 Central 11 Haywood 2018 Central 12 Lake 2018 Central 13 Lewis 2018 Central 14 Benton 2018 East 15 Cannon 2018 East 16 Clay 2018 East 17 Crockett 2018 East 18 Dyer 2018 East 19 Franklin 2018 East 20 Hancock 2018 East 21 Houston 2018 East 22 Humphreys 2018 East 23 Knox 2018 East 24 Chester 2018 North Cumberian 25 d 2018 North 26 Dekalb 2018 North 27 Dickson 2018 North 28 Fentress 2018 North 29 Grainger 2018 North 30 Greene 2018 North 31 Hardin 2018 North 32 Henry 2018 North 33 Hickman 2018 North 34 Jefferson 2018 North 35 Lauderdale 2018 North 36 Blount 2018 South 37 Bradley 2018 South 38 Carroll 2018 South 39 Claibome 2018 South 40 Grundy 2018 South 41 Hardeman 2018 South 42 Henderson 2018 South 43 Jackson 2018 South 44 Anderson 2018 West 45 Campbell 2018 West 46 Cheatam 2018 West 47 Davidson 2018 West 48 Gibson 2018 West 49 Hawkins 2018 West 50 Johnson 2018 West 51 Lawrence 2018 West D HCS $5.089.60 $6,393.70 $9.640.10 $3.992.00 $2.752.50 $6,934.20 $6,857.70 $540.50 $3.867.90 $3,634.50 $7.943.30 $700.50 $4,080.30 $1.367.80 $6.124.50 $6,082.30 $7.594.30 $931.70 $1,757.00 $655.20 $7.602.40 $1.035.00 $1.395.70 $5.557.90 52.413.30 $9.994.00 $4.709.90 $1.909.90 $1.266.50 $15.997.00 $1.913.10 $6,834.70 $2.753.60 $6.139.60 $26,254.60 $3,701.70 $18.694.80 $13,000.10 $12,244.90 $29.914.90 $17.090.50 $22,325.20 $1,192.20 55.262.00 S2.108.10 $10,811.10 $10,444.80 54.228.70 58,353.60 52.486.00 E IM 9.90% 6.90% 8.00% 9.10% 7.90% 8.00% 7.50%, 8.50% 8.30% 7.80% 7.90% 7.30% 7.70% 7.50% 7.60% 7.30% 8.90% 8.10% 8.70% 9.20% 8.30% 10.50% 6.80% 9.20% 7.30% 7.90% 10.00% 8.90% 7.30% 7.70% 7.40% 8.60% 11.00% 7.10% 6.20% 7.60% 7.00 6.7096 7.90% 5.60% 7.60% 6.30% 9.10% 8.90% 8.90% 6.50% 8.50% 8.50 7.80% 7.50% F G PCI POV $32.517.00 $35.427.00 14% $35.242.00 14% $35.840.00 22% $37.624.00 11% $46,764.00 8% $35.479.00 13% $30.220.00 23% $31,684.00 18% $35.983.00 13% $42.189.00 11% $45.236.00 15% $31,339.00 18% $39.827.00 10% $33.654.00 $31.155.00 17% $41.652.00 10% $33.614.00 14% $39.874.00 14% $36,932.00 13% $34.159.00 16% $37.849.00 21% $32.570.00 12% $35,729.00 19% $34.947.00 12% $34.381.00 14% $29.580.00 21% $37.902.00 11% $43.014.00 7% $35.117.00 13% $40,381.00 1296 $31.981.00 15% $32.440.00 $36.782.00 11% $43.216.00 12% $42.725.00 $39.226.00 12% $41.927.00 $50.240.00 $47.474.00 5% $38.897.00 1296 $37,061.00 16% $31.126.00 17% $45.903.00 5% $39.948.00 89 550.037.00 594 $34.747.00 14% $34.320.00 16% $43.227.00 1096 $29.515.00 179 10% 10% 4% Titles Area - Page Setup to-Lett Sheet Options Scale to Fit COUNTY M H N la Counties by Regions West 161 Central South R Ea 20 10% North 10% Central East North South West 13% F G PCI POY $32.517.00 19% $35.427.00 $35.242.00 $35.840,00 22% $37,624.00 1194 $46,764.00 89 $35.479.00 1396 $30,220.00 239 $31.684.00 18% $35.983.00 13% $42.189.00 119 $45.236.00 1596 $31,339.00 18% $39.827.00 $33,654.00 12% $31.155.00 17% 541.652.00 $33,644.00 149 $39.874.00 14% $36.932.00 $34,159.00 16% $37.849.00 219 $32,570.00 12% $35.729.00 19% $34.947.00 12% $34,381.00 149 $29.580.00 21% $37.902.00 11% $43.014.00 7% $35.117.00 1396 $40,381.00 129 $31,981.00 15% $32.440.00 10% $36,782.00 11% $43.216.00 12% 542,725.00 12% $39.226.00 129 $41.927.00 10% $50.240.00 4% 547.474.00 5% $38,897.00 12% $37,061.00 16% $31.126,00 17% 545.903.00 5% $39.948.00 896 550.037.00 5% $34,747.00 14% $34,320.00 543.227.00 1096 529,515.00 17% 1b Regions B West North East Central 2 10 12 14 + Sheet4 Sheets 4A. Using the data from question 1, create a line graph with markers that shows both the infant mortality rate averages and poverty rate averages for each region. Label the graph IM and Poverty" graph respectively (See Exhibit 8.4). B. Create a column and a bar graph for the average infant mortality rate and poverty rate variables by region. Label the column graph IM and Poverty Col- umn Graph and the bar graph "IM and Poverty Bar Graph (See Exhibit 8.7). . C. Which of these three graphs best describes the data? HI 19% 12% B C 1 COUNTY YEAR Region 2 Bedford 2018 Central 3 Bledsoe 2018 Central 4 Carter 2018 Central 5 Cocke 2018 Central 6 Coffee 2018 Central 7 Decatur 2018 Central 8 Fayette 2018 Central 9 Giles 2018 Central 10 Hamilton 2018 Central 11 Haywood 2018 Central 12 Lake 2018 Central 13 Lewis 2018 Central 14 Benton 2018 East 15 Cannon 2018 East 16 Clay 2018 East 17 Crockett 2018 East 18 Dyer 2018 East 19 Franklin 2018 East 20 Hancock 2018 East 21 Houston 2018 East 22 Humphreys 2018 East 23 Knox 2018 East 24 Chester 2018 North Cumberian 25 d 2018 North 26 Dekalb 2018 North 27 Dickson 2018 North 28 Fentress 2018 North 29 Grainger 2018 North 30 Greene 2018 North 31 Hardin 2018 North 32 Henry 2018 North 33 Hickman 2018 North 34 Jefferson 2018 North 35 Lauderdale 2018 North 36 Blount 2018 South 37 Bradley 2018 South 38 Carroll 2018 South 39 Claibome 2018 South 40 Grundy 2018 South 41 Hardeman 2018 South 42 Henderson 2018 South 43 Jackson 2018 South 44 Anderson 2018 West 45 Campbell 2018 West 46 Cheatam 2018 West 47 Davidson 2018 West 48 Gibson 2018 West 49 Hawkins 2018 West 50 Johnson 2018 West 51 Lawrence 2018 West D HCS $5.089.60 $6,393.70 $9.640.10 $3.992.00 $2.752.50 $6,934.20 $6,857.70 $540.50 $3.867.90 $3,634.50 $7.943.30 $700.50 $4,080.30 $1.367.80 $6.124.50 $6,082.30 $7.594.30 $931.70 $1,757.00 $655.20 $7.602.40 $1.035.00 $1.395.70 $5.557.90 52.413.30 $9.994.00 $4.709.90 $1.909.90 $1.266.50 $15.997.00 $1.913.10 $6,834.70 $2.753.60 $6.139.60 $26,254.60 $3,701.70 $18.694.80 $13,000.10 $12,244.90 $29.914.90 $17.090.50 $22,325.20 $1,192.20 55.262.00 S2.108.10 $10,811.10 $10,444.80 54.228.70 58,353.60 52.486.00 E IM 9.90% 6.90% 8.00% 9.10% 7.90% 8.00% 7.50%, 8.50% 8.30% 7.80% 7.90% 7.30% 7.70% 7.50% 7.60% 7.30% 8.90% 8.10% 8.70% 9.20% 8.30% 10.50% 6.80% 9.20% 7.30% 7.90% 10.00% 8.90% 7.30% 7.70% 7.40% 8.60% 11.00% 7.10% 6.20% 7.60% 7.00 6.7096 7.90% 5.60% 7.60% 6.30% 9.10% 8.90% 8.90% 6.50% 8.50% 8.50 7.80% 7.50% F G PCI POV $32.517.00 $35.427.00 14% $35.242.00 14% $35.840.00 22% $37.624.00 11% $46,764.00 8% $35.479.00 13% $30.220.00 23% $31,684.00 18% $35.983.00 13% $42.189.00 11% $45.236.00 15% $31,339.00 18% $39.827.00 10% $33.654.00 $31.155.00 17% $41.652.00 10% $33.614.00 14% $39.874.00 14% $36,932.00 13% $34.159.00 16% $37.849.00 21% $32.570.00 12% $35,729.00 19% $34.947.00 12% $34.381.00 14% $29.580.00 21% $37.902.00 11% $43.014.00 7% $35.117.00 13% $40,381.00 1296 $31.981.00 15% $32.440.00 $36.782.00 11% $43.216.00 12% $42.725.00 $39.226.00 12% $41.927.00 $50.240.00 $47.474.00 5% $38.897.00 1296 $37,061.00 16% $31.126.00 17% $45.903.00 5% $39.948.00 89 550.037.00 594 $34.747.00 14% $34.320.00 16% $43.227.00 1096 $29.515.00 179 10% 10% 4% Titles Area - Page Setup to-Lett Sheet Options Scale to Fit COUNTY M H N la Counties by Regions West 161 Central South R Ea 20 10% North 10% Central East North South West 13% F G PCI POY $32.517.00 19% $35.427.00 $35.242.00 $35.840,00 22% $37,624.00 1194 $46,764.00 89 $35.479.00 1396 $30,220.00 239 $31.684.00 18% $35.983.00 13% $42.189.00 119 $45.236.00 1596 $31,339.00 18% $39.827.00 $33,654.00 12% $31.155.00 17% 541.652.00 $33,644.00 149 $39.874.00 14% $36.932.00 $34,159.00 16% $37.849.00 219 $32,570.00 12% $35.729.00 19% $34.947.00 12% $34,381.00 149 $29.580.00 21% $37.902.00 11% $43.014.00 7% $35.117.00 1396 $40,381.00 129 $31,981.00 15% $32.440.00 10% $36,782.00 11% $43.216.00 12% 542,725.00 12% $39.226.00 129 $41.927.00 10% $50.240.00 4% 547.474.00 5% $38,897.00 12% $37,061.00 16% $31.126,00 17% 545.903.00 5% $39.948.00 896 550.037.00 5% $34,747.00 14% $34,320.00 543.227.00 1096 529,515.00 17% 1b Regions B West North East Central 2 10 12 14 + Sheet4 Sheets