this is done in excel can you please do this in an excel file that i can export and download please give step by step on how yo input excel functions please and thank you

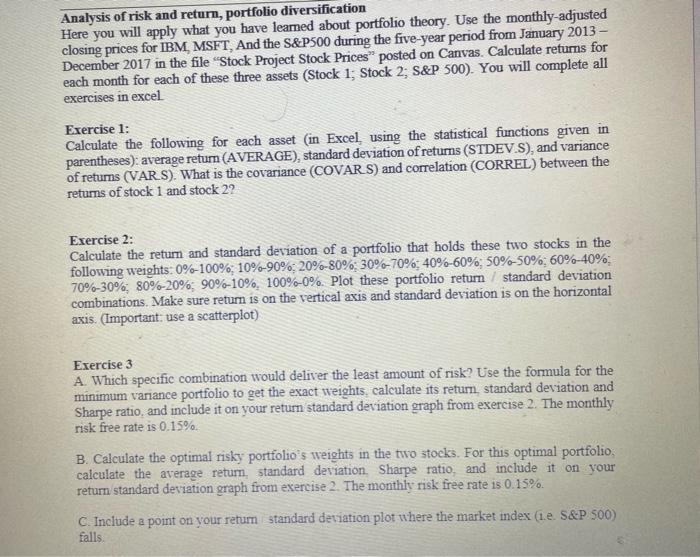
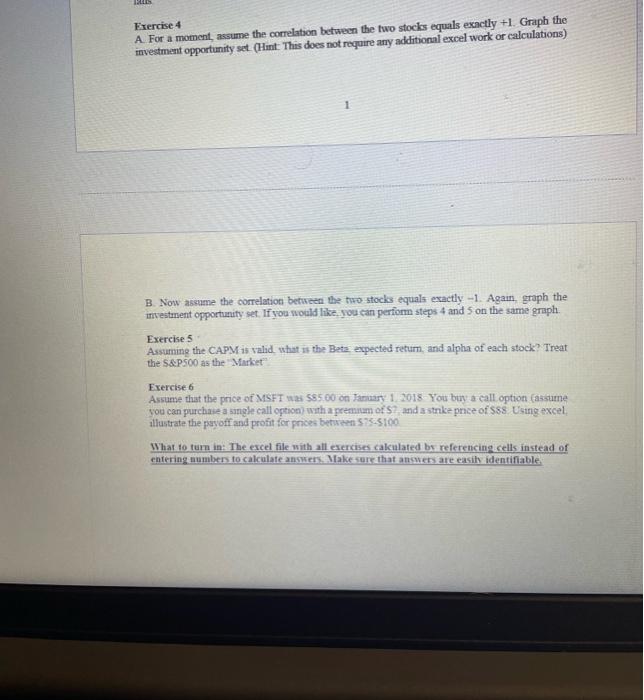
Analysis of risk and return, portfolio diversification Here you will apply what you have leamed about portfolio theory. Use the monthly-adjusted closing prices for IBM, MSFT, And the S\&P500 during the five-year period from January 2013 December 2017 in the file "Stock Project Stock Prices" posted on Canvas. Calculate returns for each month for each of these three assets (Stock 1; Stock 2; S\&P 500). You will complete all exercises in excel Calculate the following for each asset (in Excel, using the statistical functions given in Exercise 1: parentheses): average return (AVERAGE), standard deviation of returns (STDEV.S), and variance of returns (VAR.S). What is the covariance (COVAR.S) and correlation (CORREL) between the returns of stock 1 and stock 2 ? Exercise 2: Calculate the return and standard deviation of a portfolio that holds these two stocks in the following weights: 0%100%;10%90%;20%80%;30%70%;40%60%;50%50%;60%40%; 70%30%;80%20%;90%10%,100%0%. Plot these portfolio return/standard deviation combinations. Make sure return is on the vertical axis and standard deviation is on the horizontal axis. (Important: use a scatterplot) Exercise 3 A. Which specific combination would deliver the least amount of risk? Use the formula for the minimum variance portfolio to get the exact weights, calculate its retum, standard deviation and Sharpe ratio, and include it on your return standard deviation graph from exercise 2. The monthly risk free rate is 0.15%. B. Calculate the optimal risky portfolio's weights in the two stocks. For this optimal portfolio, calculate the average retur, standard deviation. Sharpe ratio, and include it on your return standard deviation graph from exercise 2. The monthly risk free rate is 0.15%. A. For a moment, assume the correlation bctween the fwo stocks equals exactly +1 . Graph the Erercise 4 investment opportunity set. (Hint: This does not require any additional excel work or calculations) B. Now a6sume the correlation between the two stocks equale exactly -1 . Again, graph the investment opportunity set. If you woald like, you can periom steps 4 and 5 on the same graph. Exercse 5 Assuming the CAPM is valid, what is the Beta expected retum, and alpha of each stock? Treat the S.SPSO0 as the "Market" Exercise 6 Assume that the price of MSFI was 585,00 on January 1.2018- Yous buy a call option (assume you can purchaie a single call option) with a premium of S7, and a stnke pnce of S\$s. Using excel Allustrate the psyoff and profit for prices between 5755100 What to tum in: The excel file with all exercises cakulated bs referencing cells instead of entering aumbers to calculate answers. Make sure that ancwers are easity identifiable


