This is excel Bus problem solving questions 1 234567-
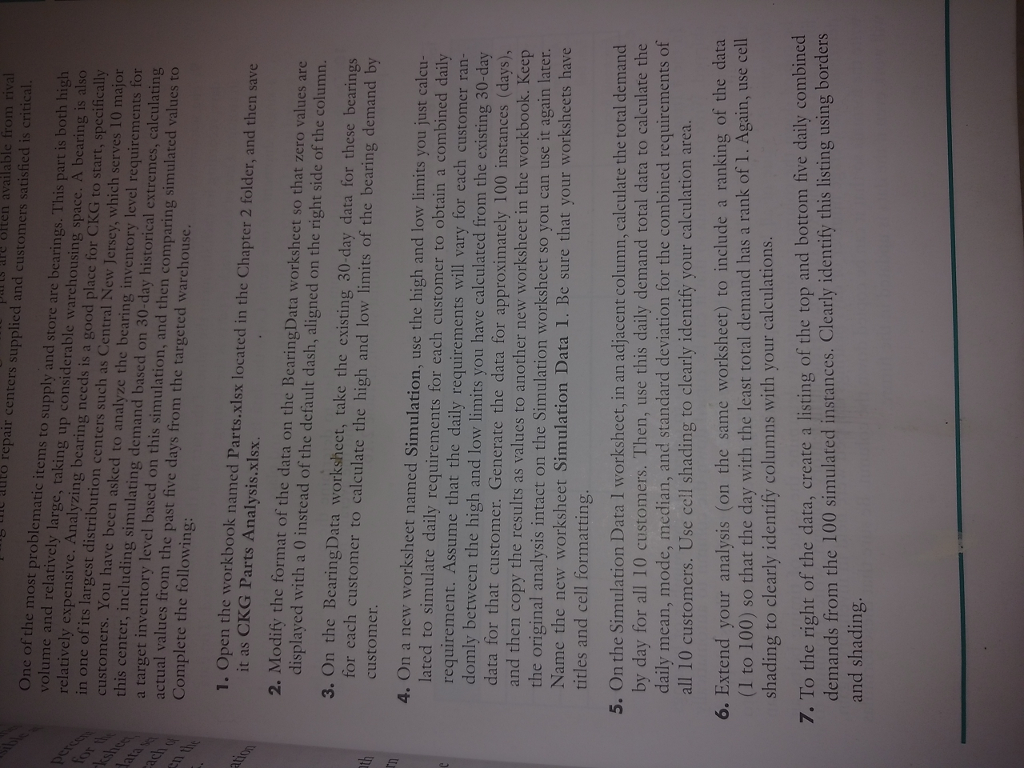
One of the most problematic items to supply and store are bearings. This part is both high volume and relatively large, taking up by considerable warehousing space. A bearing is also relatively expensive. Analyzing bearing needs is a good place for CKG to start, specifically in one of its largest distribution center such as Central New Jersey, which serves 10 major customers. You have been asked to analyze the bearing inventory level requirements for this center, including simulating demand based on 30-day historical extremes, calculating a target inventory level based on this simulation, and then comparing simulated values to actual values from the past five days from the targeted warehouse. Open the workbook named Parts.xlsx located in the Chapter 2 folder, and then save it as CKG Parts Analysis.xlsx. Modify the format of the data on the Bearing Data worksheet so that zero values are displayed with a 0 instead of the default dash, aligned on the right side of the column. On the Bearing Data worksheet, take the existing 30-day data for these bearing for each customer the high and low limits of the bearing demand by customer. On a new worksheet named simulation. Use the high and low limits you just calculated to simulate daily requirements for each customer to obtain a combined daily requirements. Assume that the daily requirements will vary for each customer to obtain a combined daily requirement. Assume that the daily requirements will vary for each customer randomly between the high and low limits you have calculated from the existing 30-dav data for that customer. Generate the data for approximately 100 instances (days), and then copy the results as values to another new worksheet in the workbook. Keep the original analysis intact on the Simulation worksheet so you can use it again later. Name the new worksheet Simulation Data 1. Be sure that your worksheets have cell and cell formatting. On the Simulation Data 1 worksheet, in an adjacent column, calculate the total demand by day for all 10 customers. Then, use this daily demand total data to calculate the daily mean, mode, median, and standard deviation for the combined requirements of all 10 customers. Use cell shading to clearly identify your calculation area. Extend your analysis (on the same worksheet) to include a ranking of the data (1 to 100) so that the day with the least total demand has a rank of 1. Again, use cell shading to clearly identify columns with your calculations. To the right of the data, create a listing of the top and bottom five daily combined demands from the 100 simulated Instances. Clearly identity this listing using borders and shading. One of the most problematic items to supply and store are bearings. This part is both high volume and relatively large, taking up by considerable warehousing space. A bearing is also relatively expensive. Analyzing bearing needs is a good place for CKG to start, specifically in one of its largest distribution center such as Central New Jersey, which serves 10 major customers. You have been asked to analyze the bearing inventory level requirements for this center, including simulating demand based on 30-day historical extremes, calculating a target inventory level based on this simulation, and then comparing simulated values to actual values from the past five days from the targeted warehouse. Open the workbook named Parts.xlsx located in the Chapter 2 folder, and then save it as CKG Parts Analysis.xlsx. Modify the format of the data on the Bearing Data worksheet so that zero values are displayed with a 0 instead of the default dash, aligned on the right side of the column. On the Bearing Data worksheet, take the existing 30-day data for these bearing for each customer the high and low limits of the bearing demand by customer. On a new worksheet named simulation. Use the high and low limits you just calculated to simulate daily requirements for each customer to obtain a combined daily requirements. Assume that the daily requirements will vary for each customer to obtain a combined daily requirement. Assume that the daily requirements will vary for each customer randomly between the high and low limits you have calculated from the existing 30-dav data for that customer. Generate the data for approximately 100 instances (days), and then copy the results as values to another new worksheet in the workbook. Keep the original analysis intact on the Simulation worksheet so you can use it again later. Name the new worksheet Simulation Data 1. Be sure that your worksheets have cell and cell formatting. On the Simulation Data 1 worksheet, in an adjacent column, calculate the total demand by day for all 10 customers. Then, use this daily demand total data to calculate the daily mean, mode, median, and standard deviation for the combined requirements of all 10 customers. Use cell shading to clearly identify your calculation area. Extend your analysis (on the same worksheet) to include a ranking of the data (1 to 100) so that the day with the least total demand has a rank of 1. Again, use cell shading to clearly identify columns with your calculations. To the right of the data, create a listing of the top and bottom five daily combined demands from the 100 simulated Instances. Clearly identity this listing using borders and shading


