THIS IS FOR STAT PLEASE ASNWER CLEARLY Q1 ( A value of x= 2.9 ( IS OR IS NOT ) possible because x is a
THIS IS FOR STAT PLEASE ASNWER CLEARLY
Q1 ( A value of x= 2.9 ( IS OR IS NOT ) possible because x is a ( CONTINOUES OR DIRCRITE) random variable.
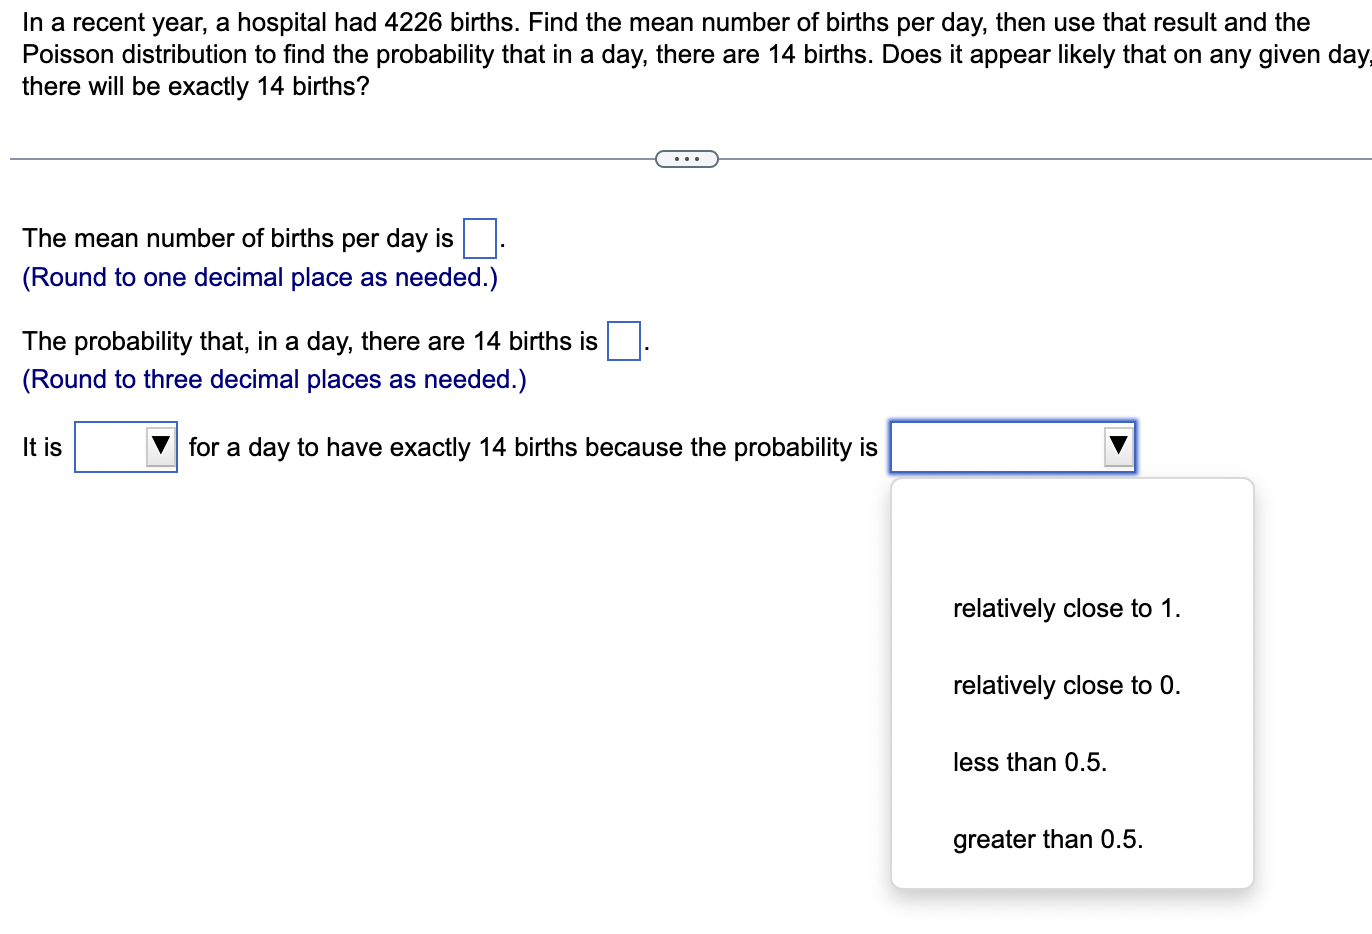
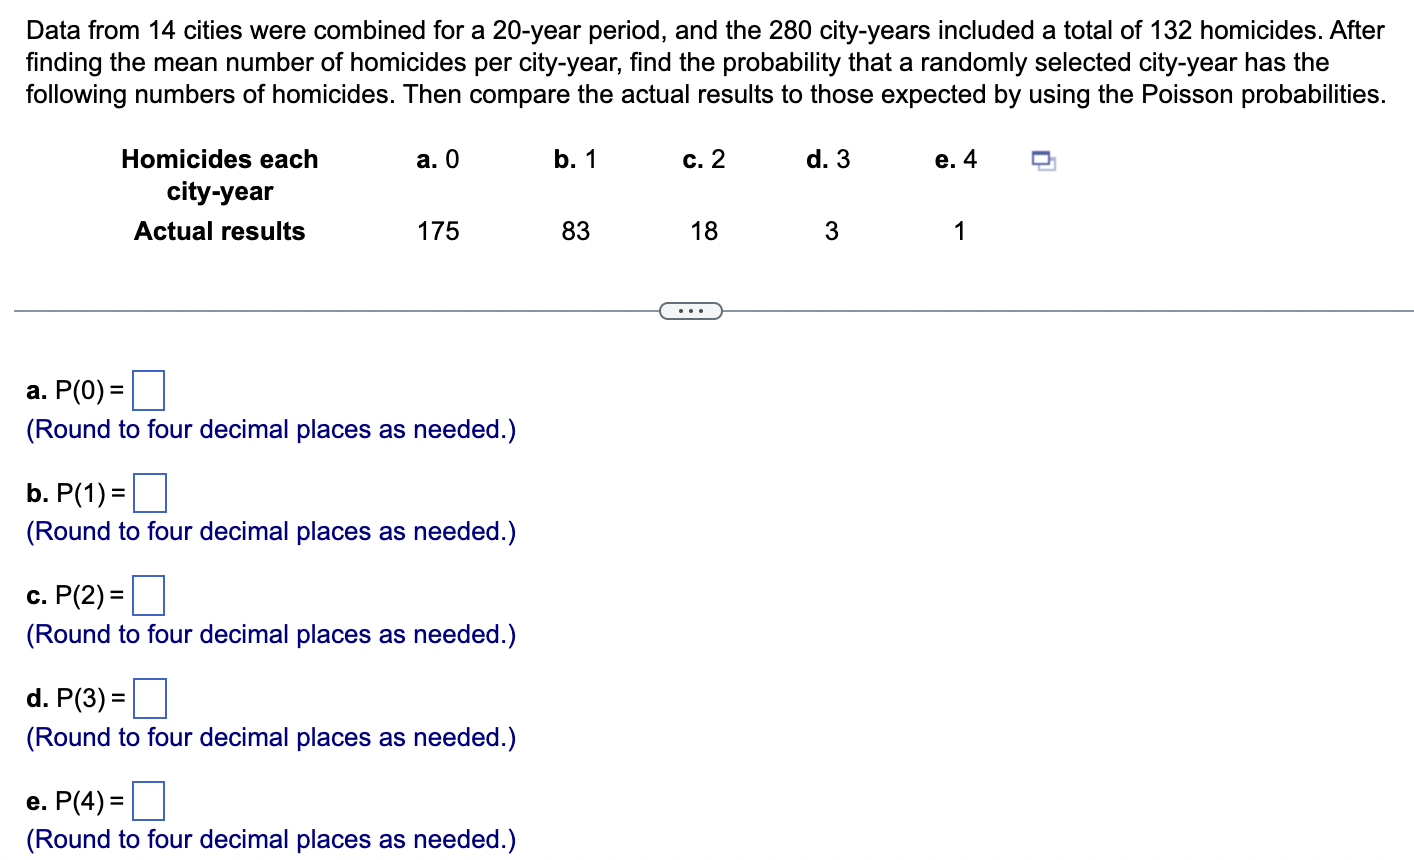
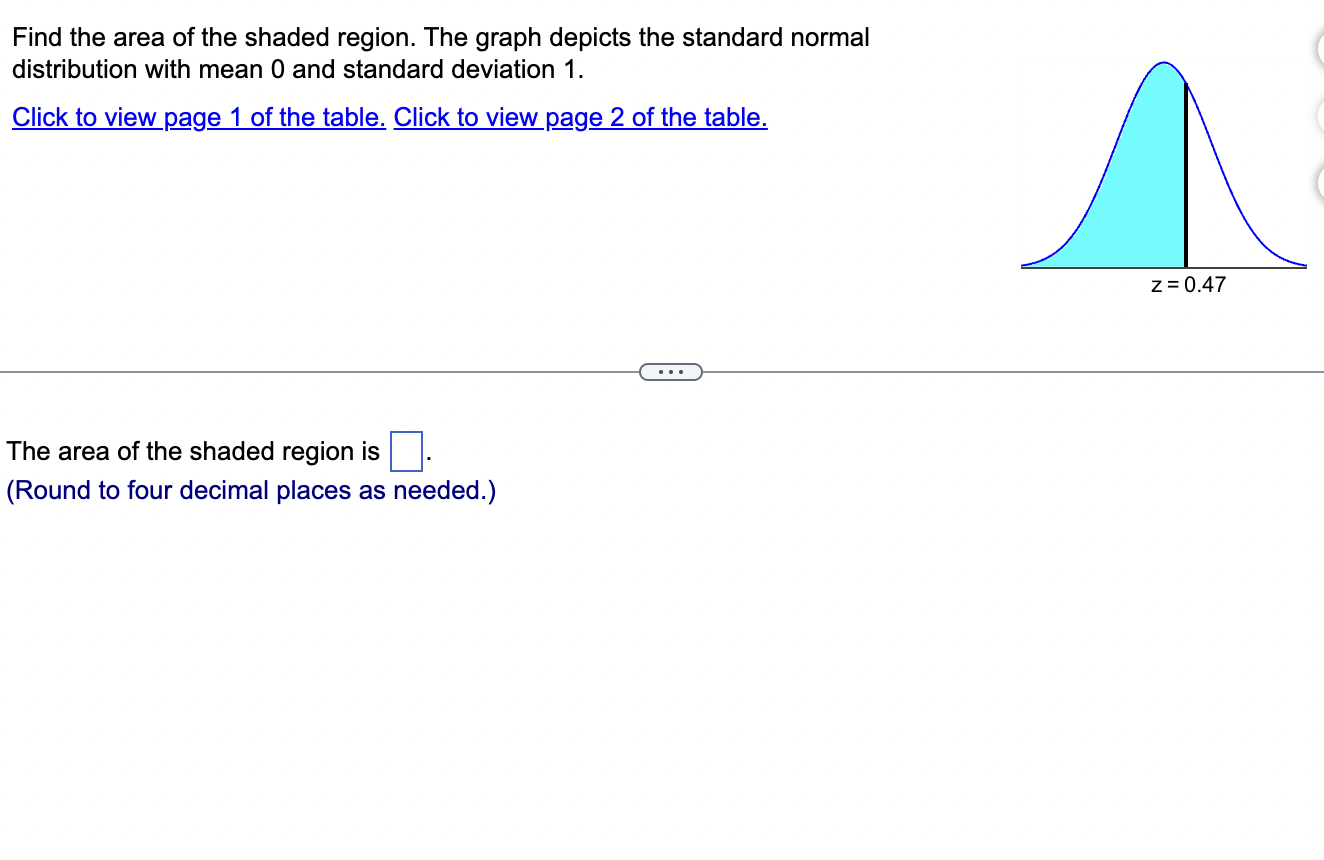
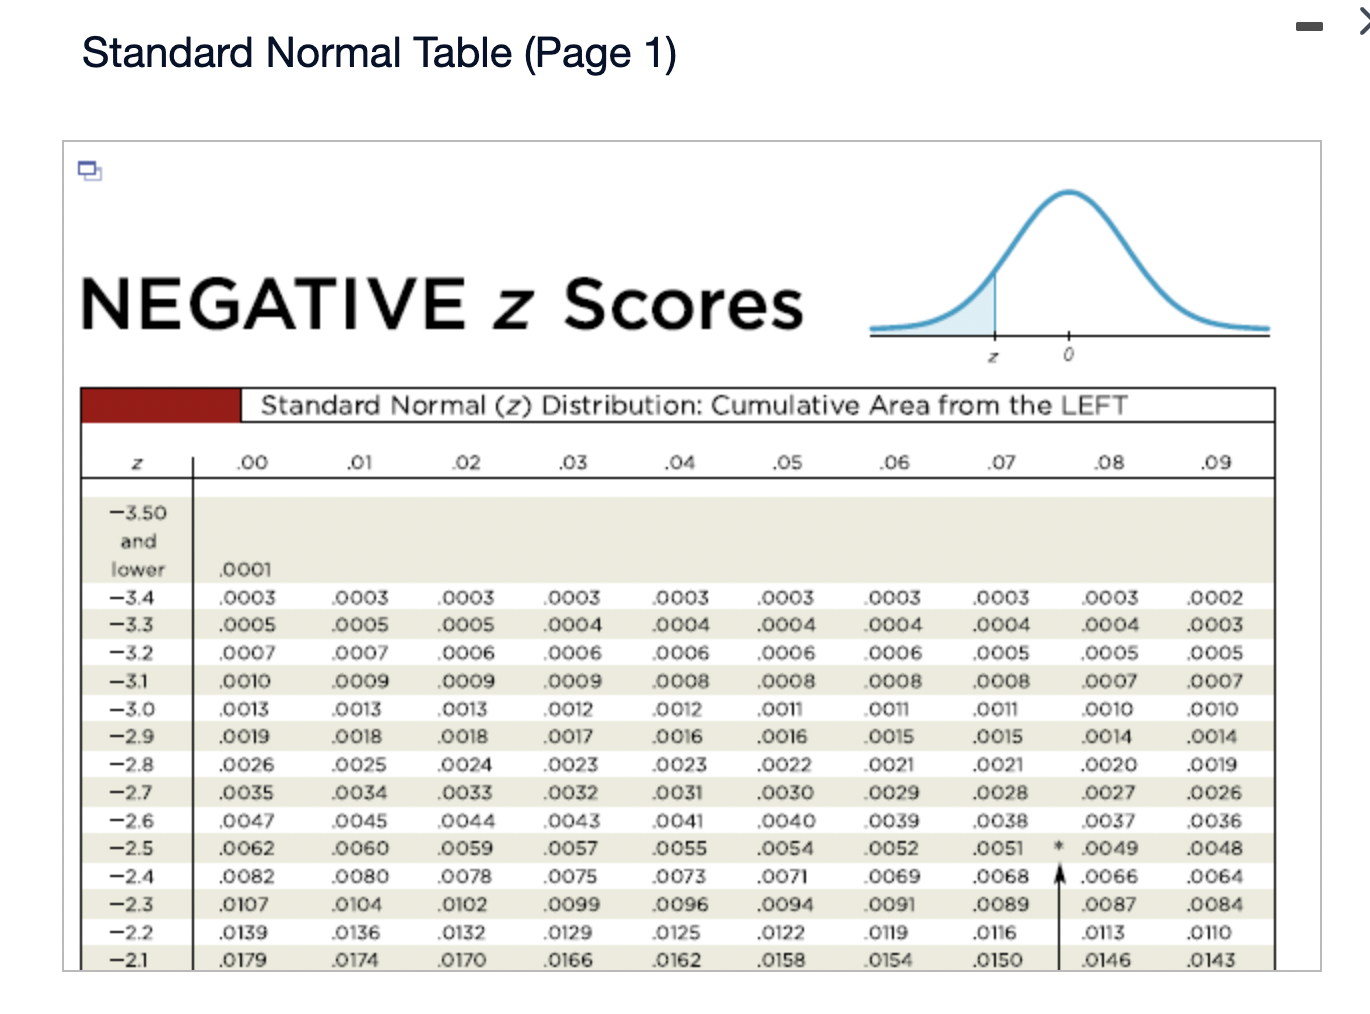
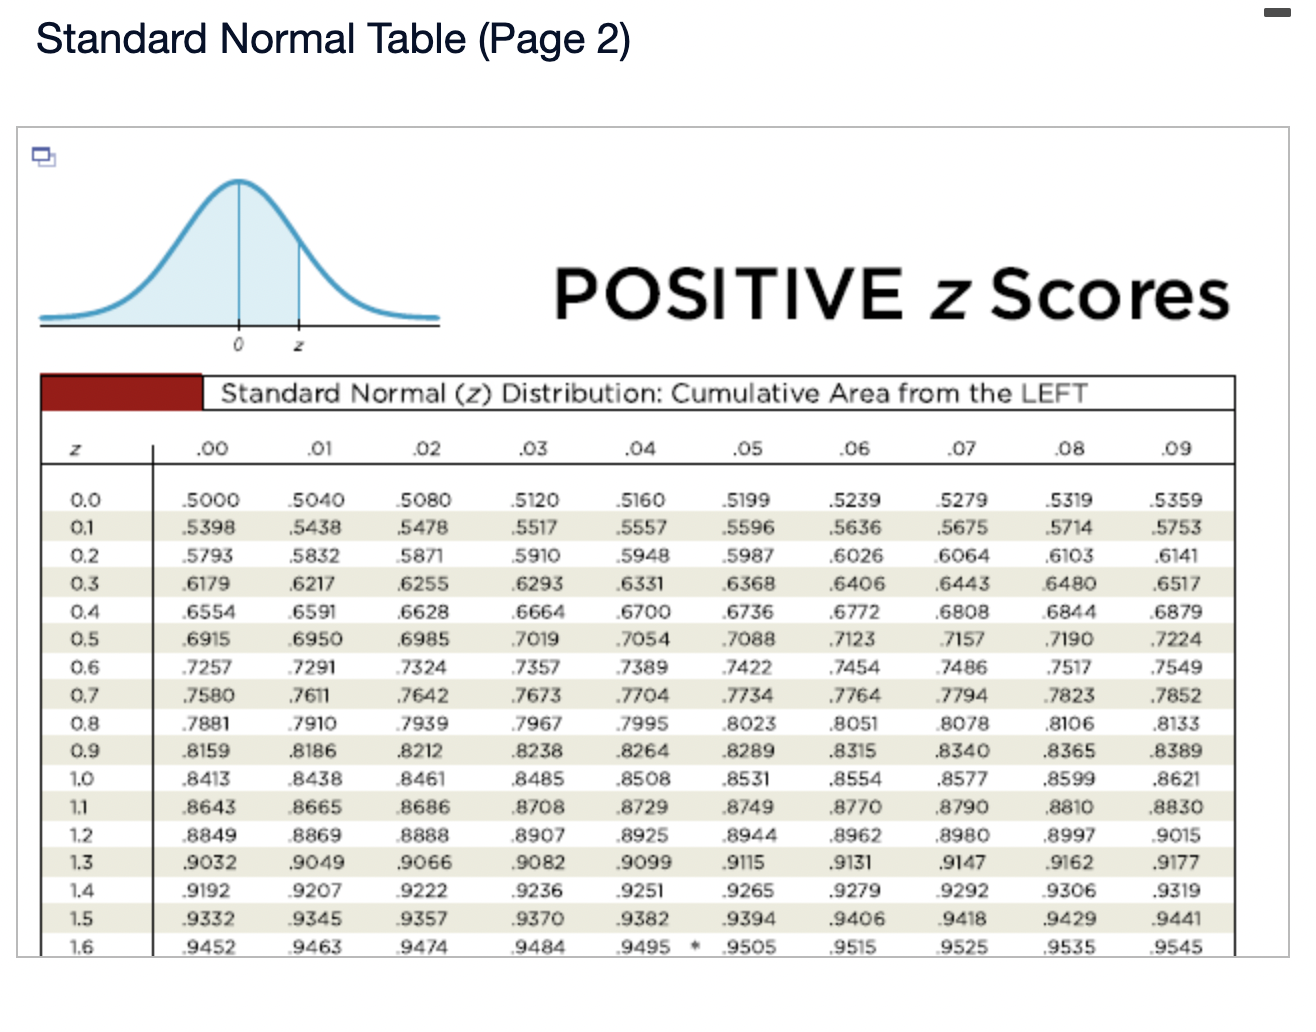
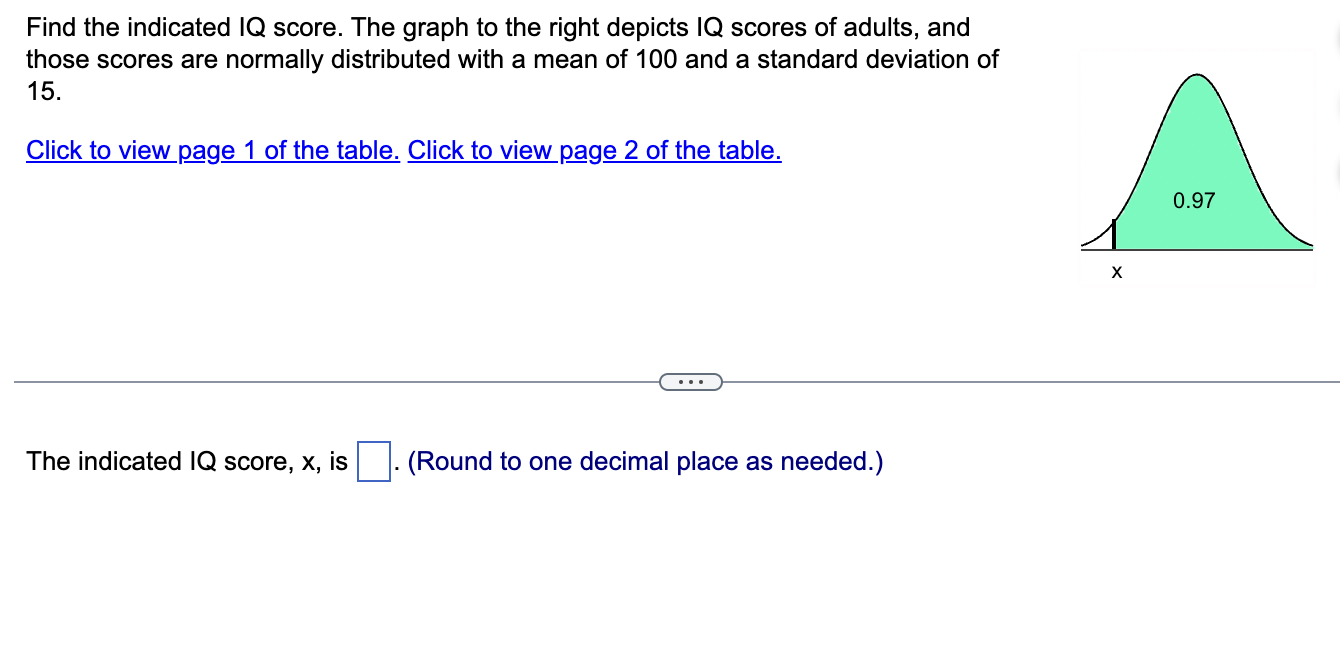
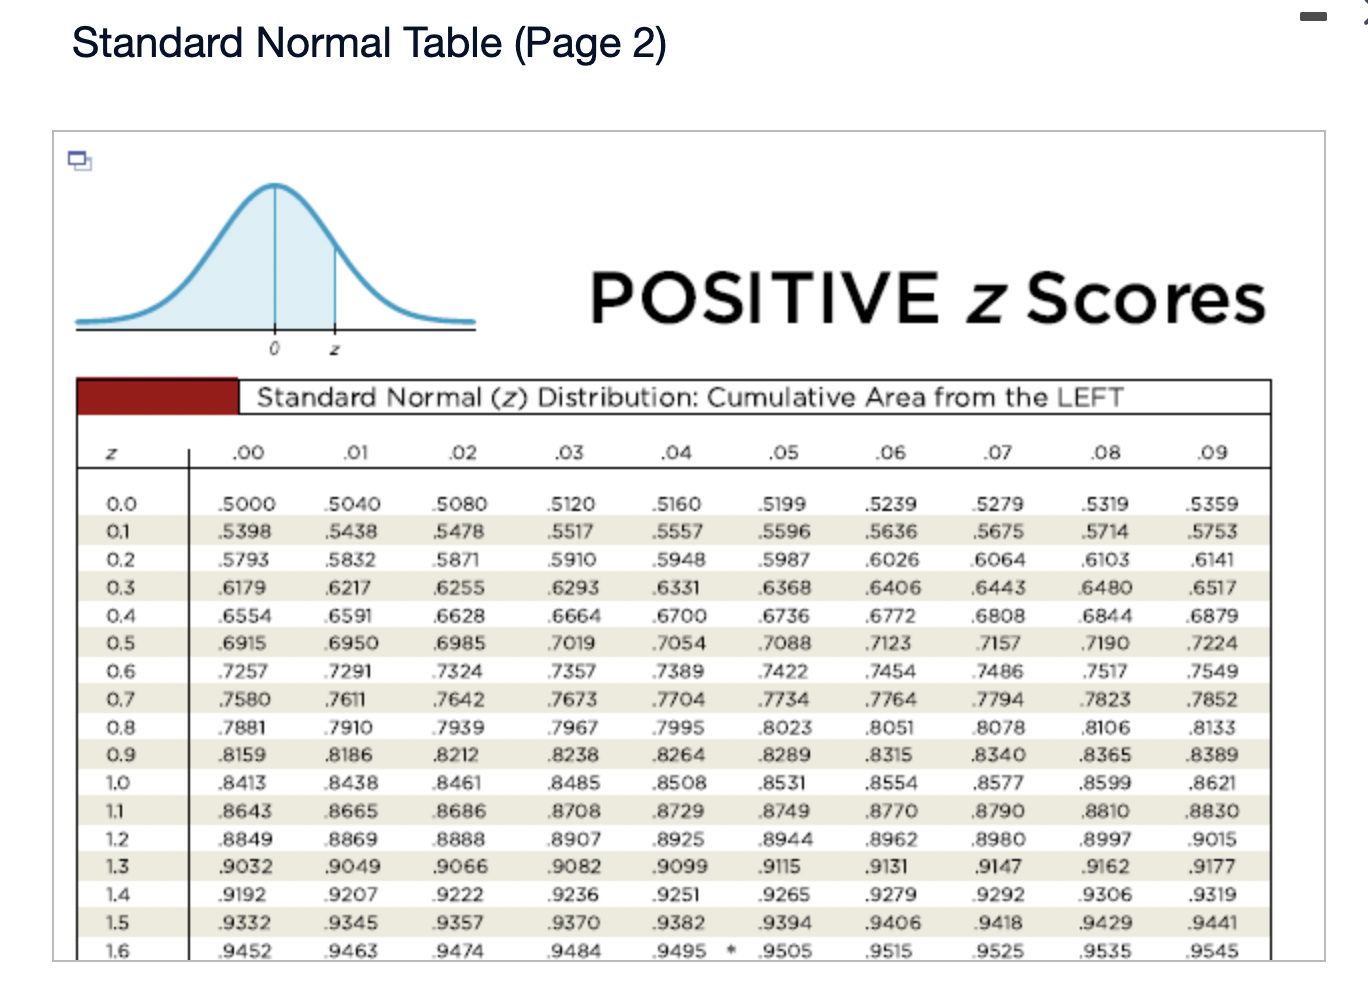
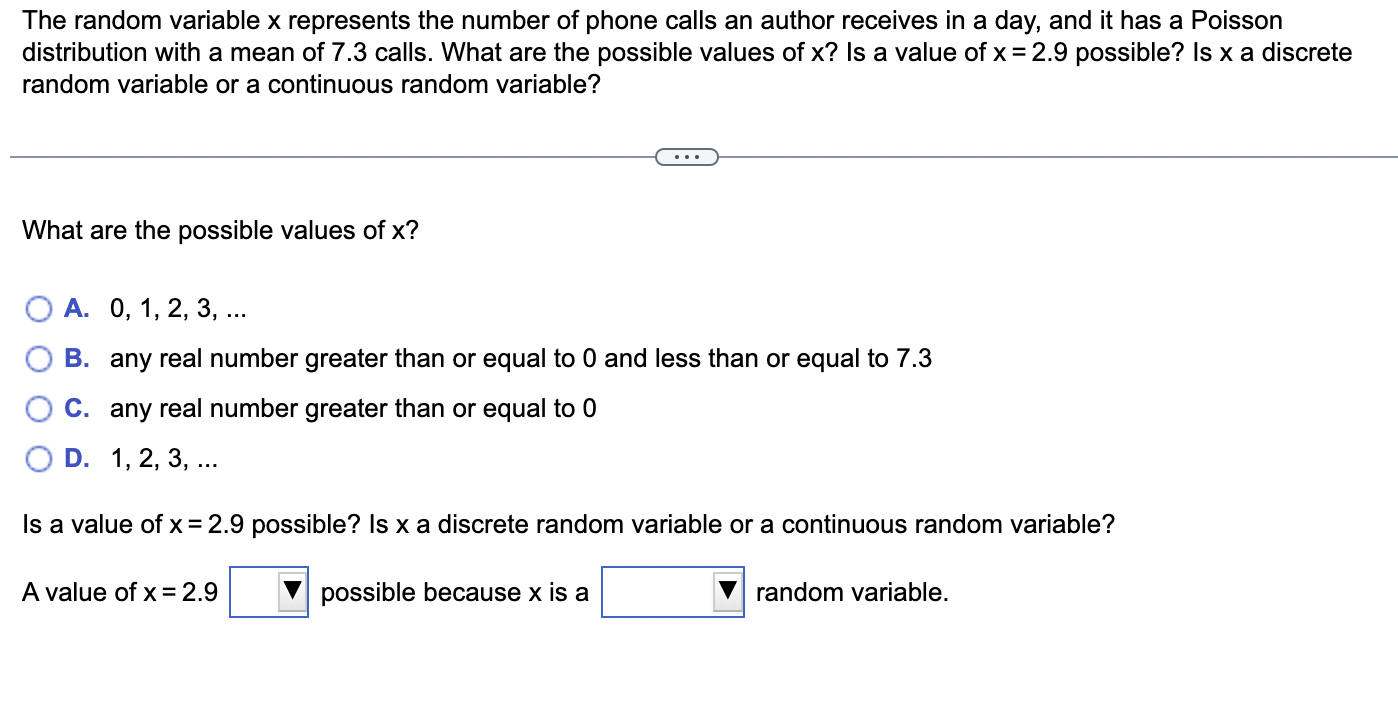
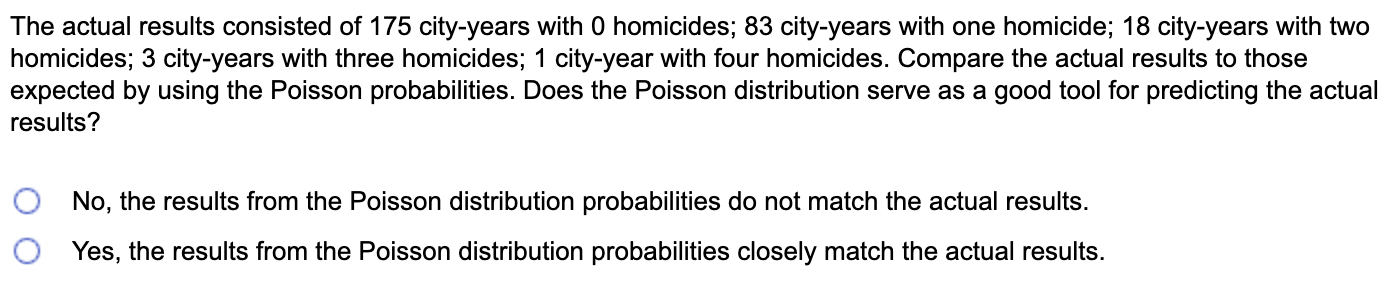
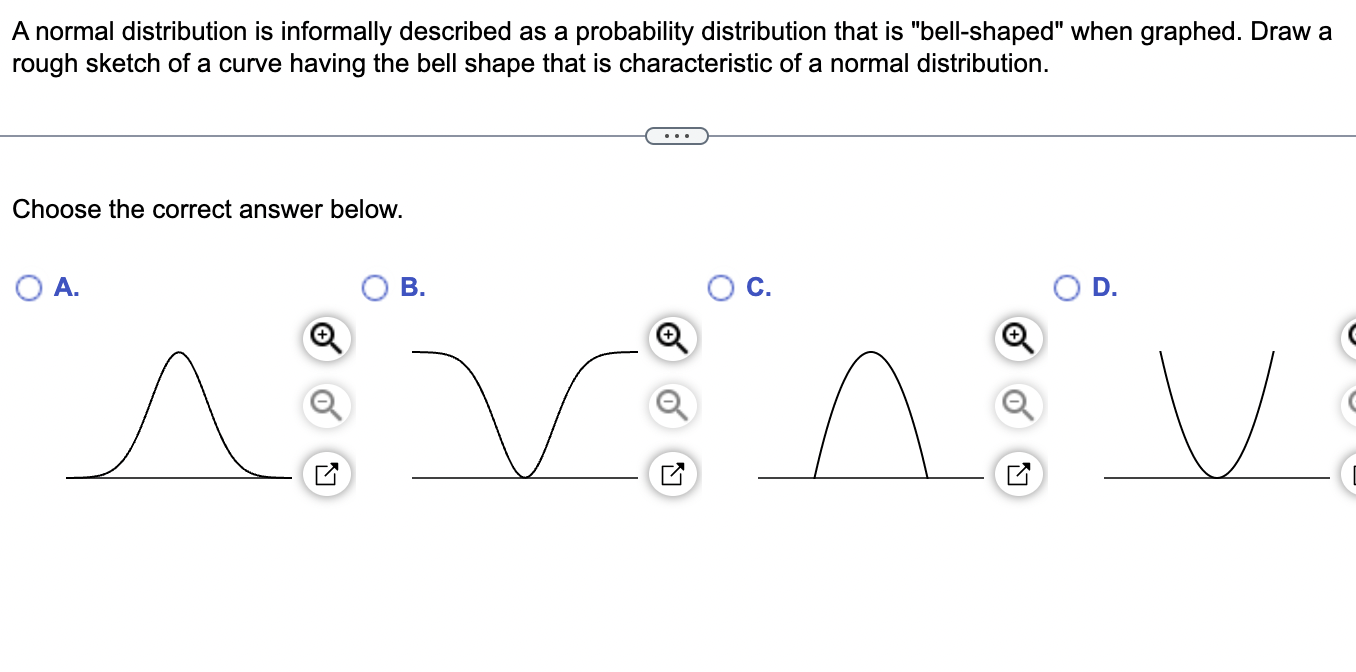
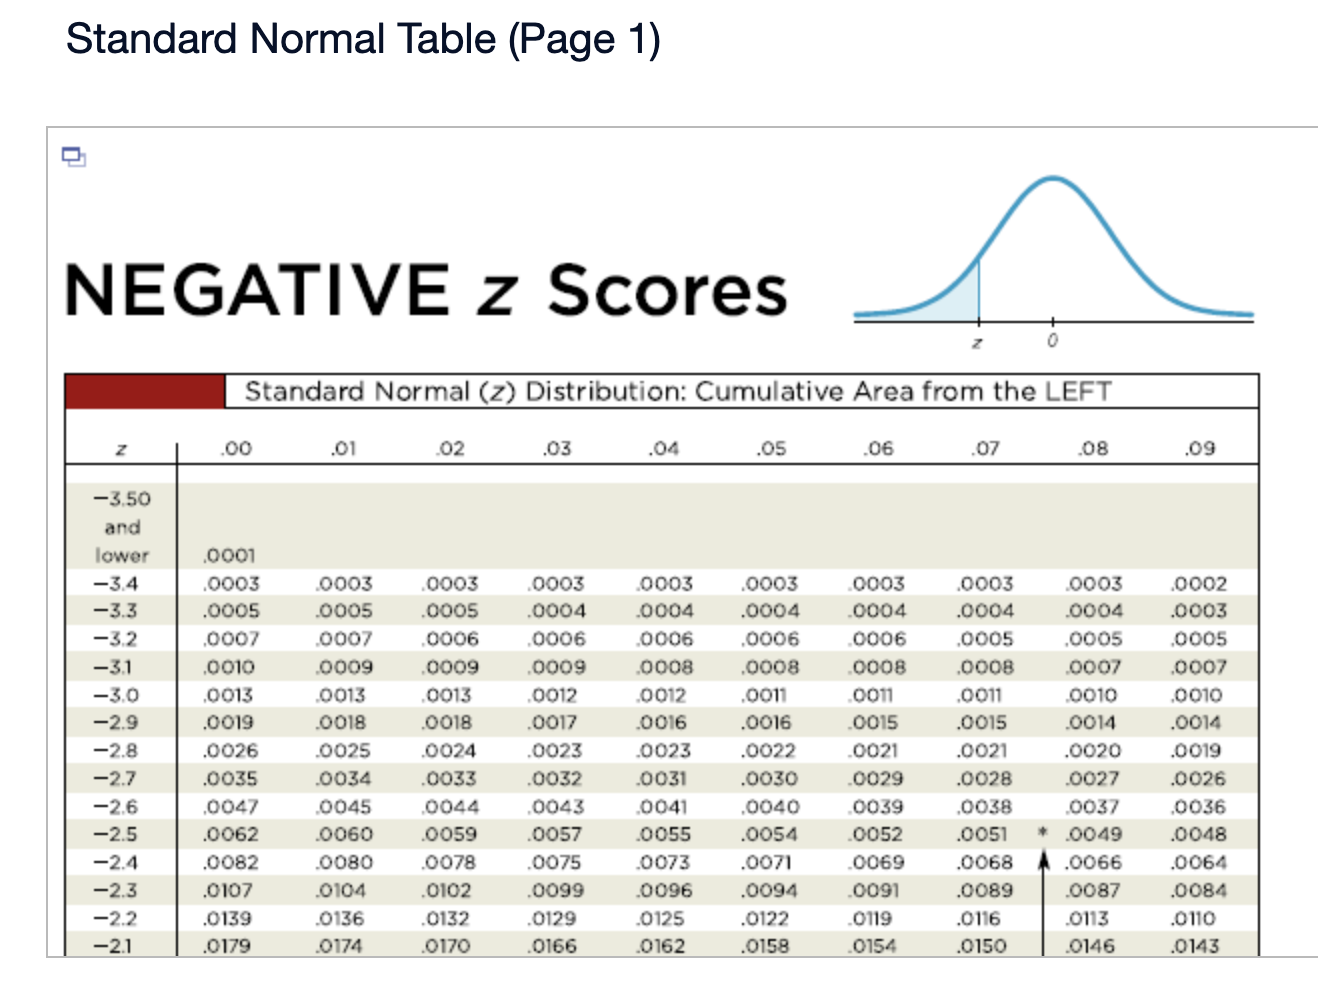
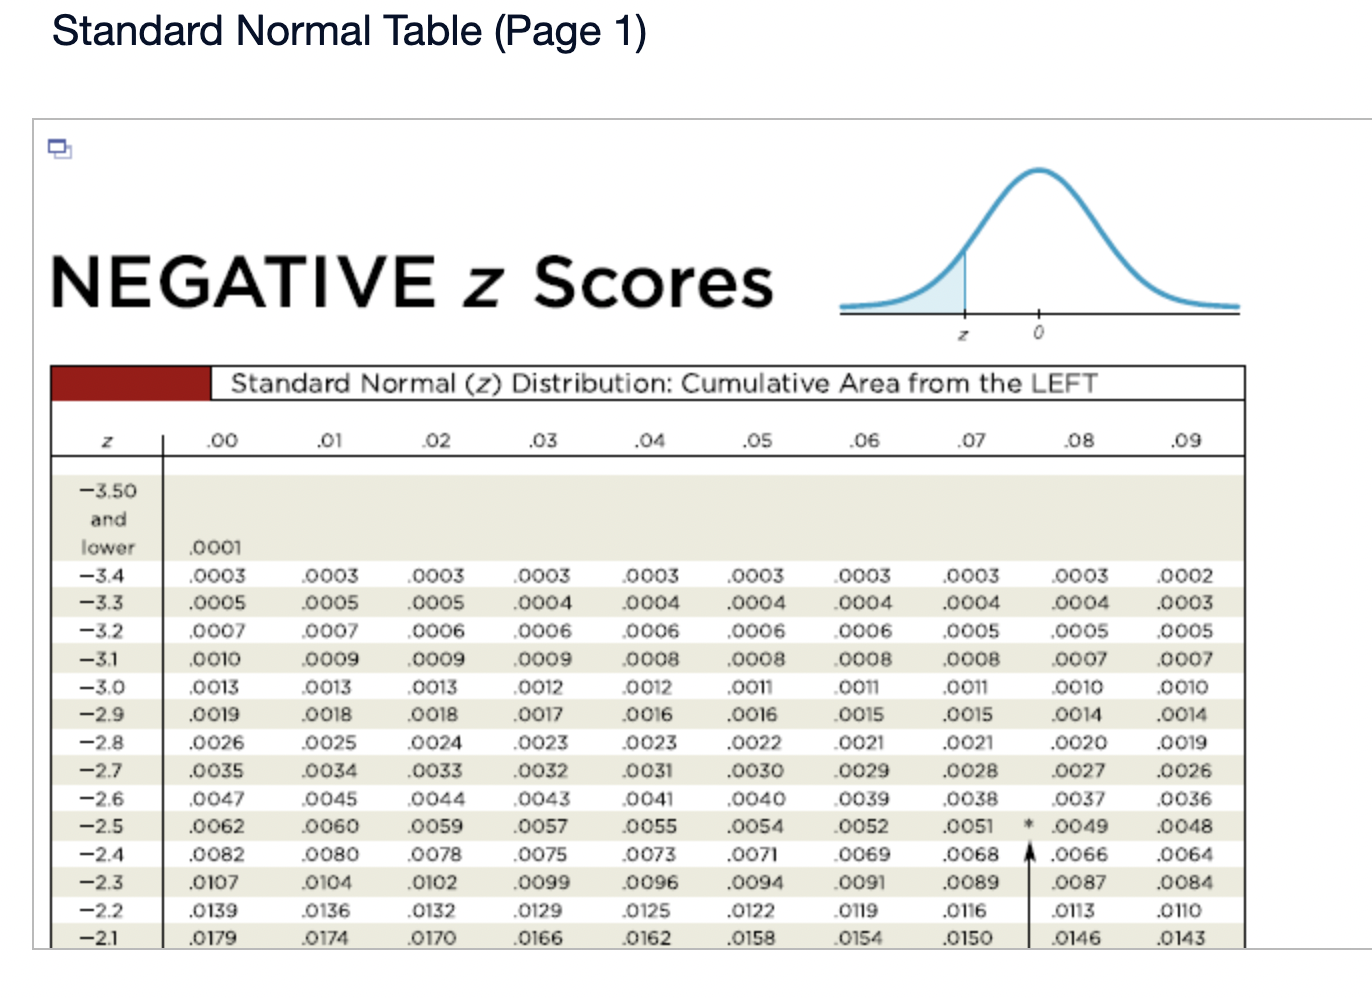
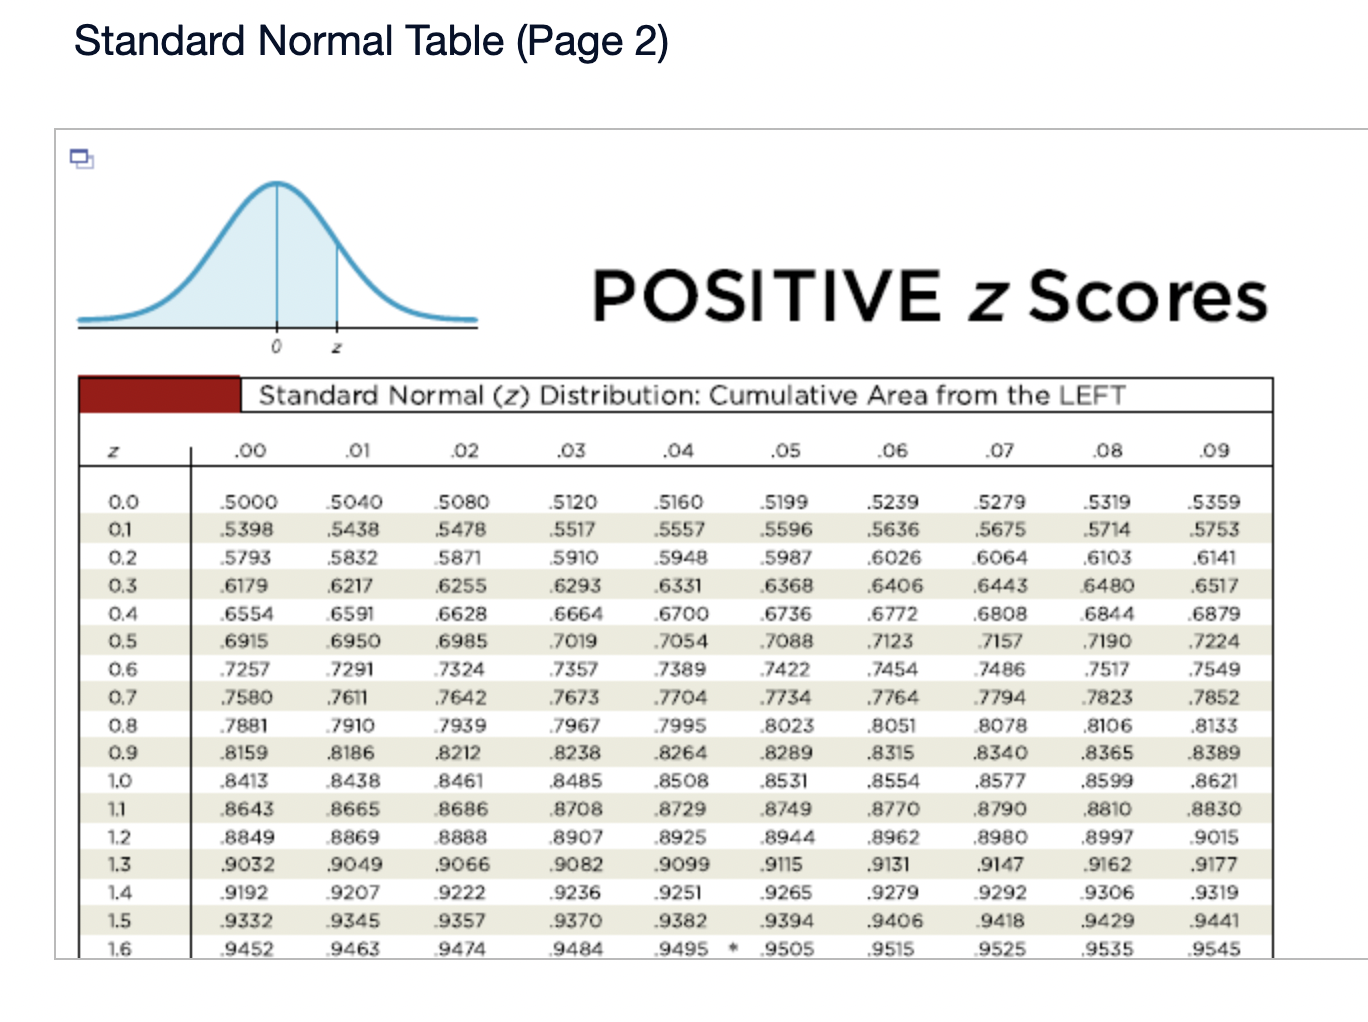
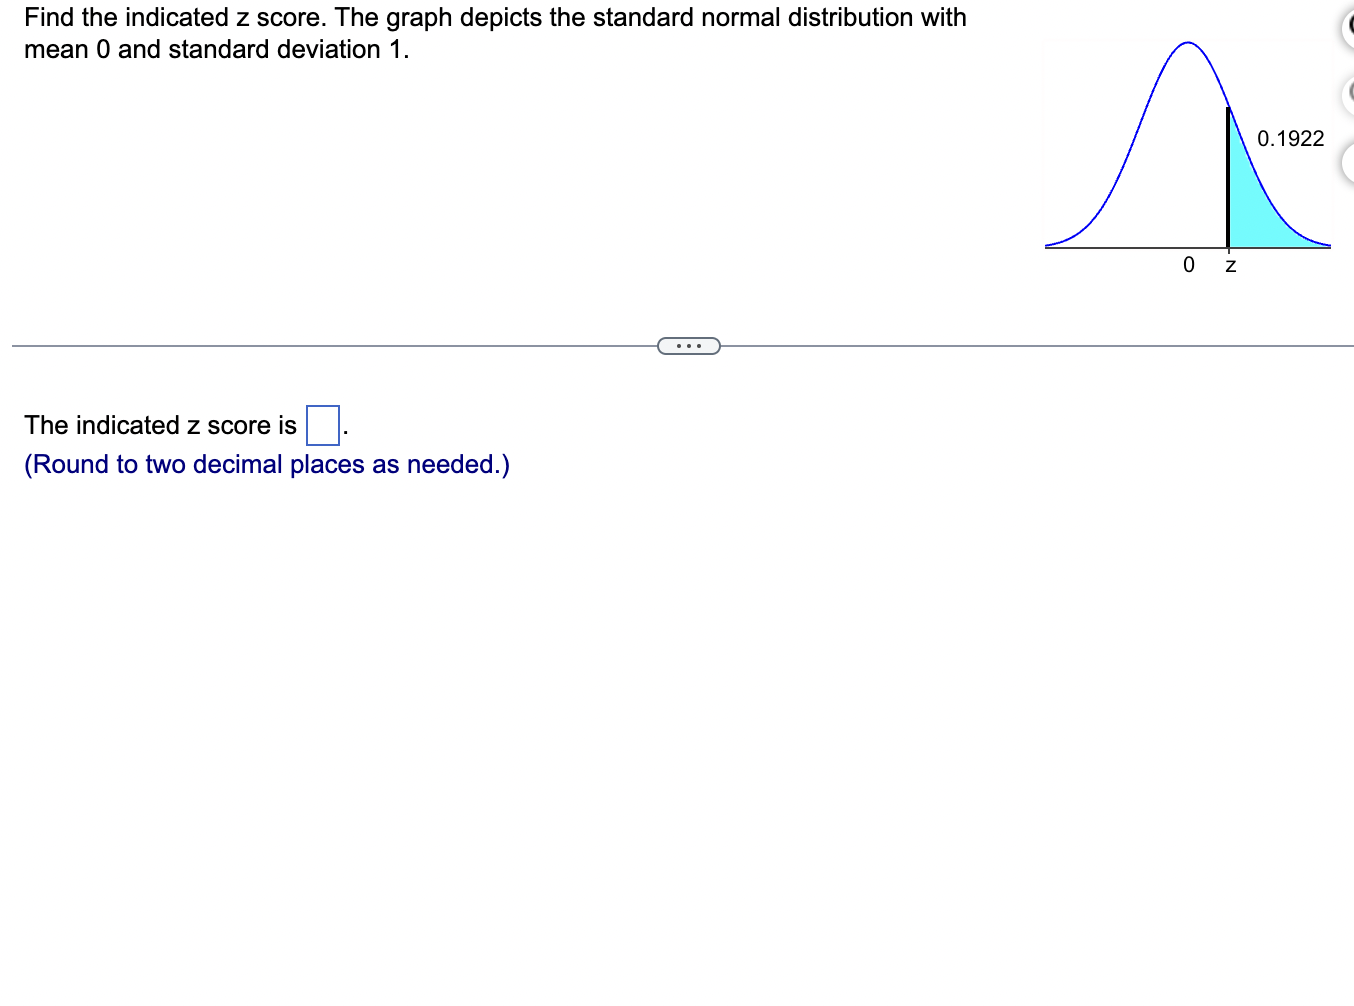
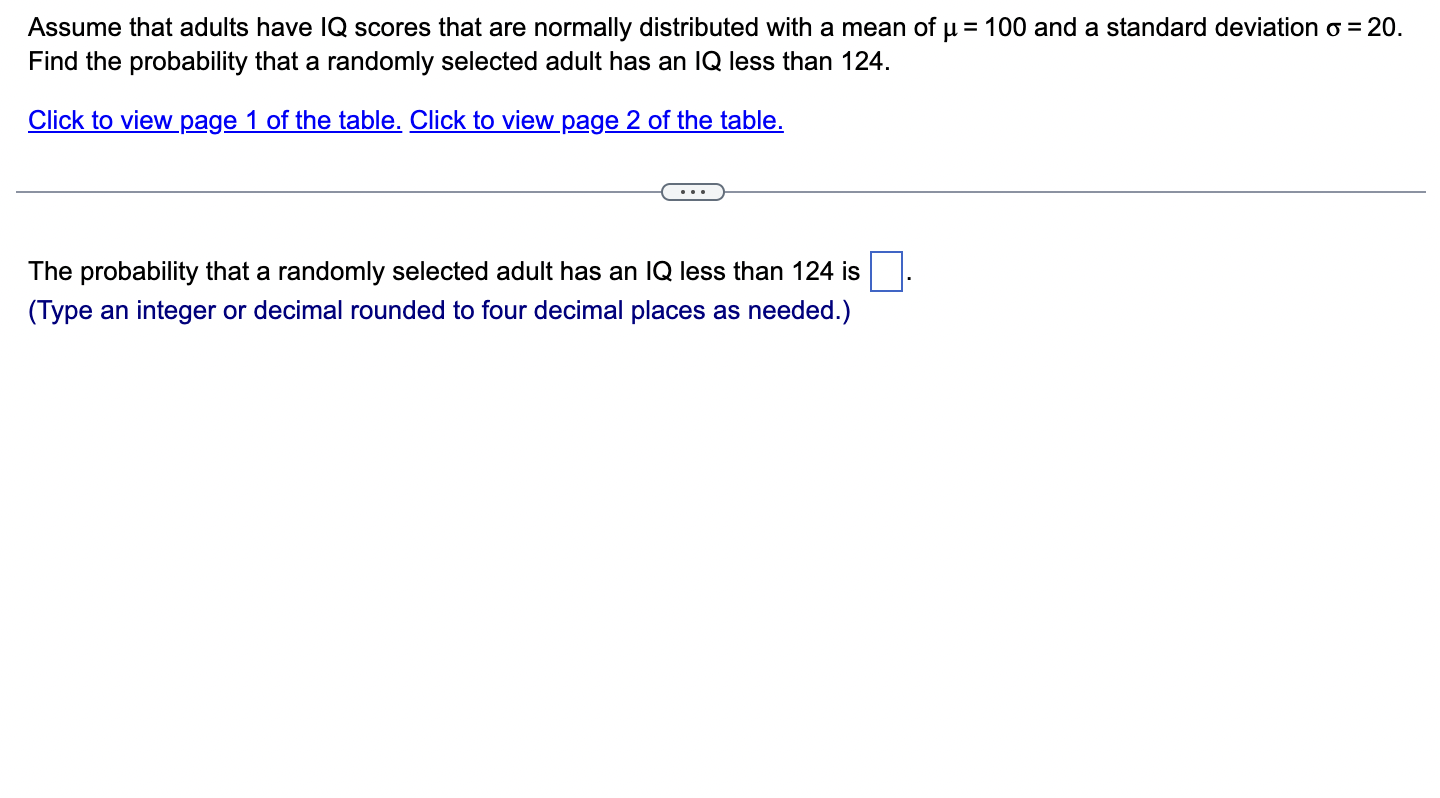
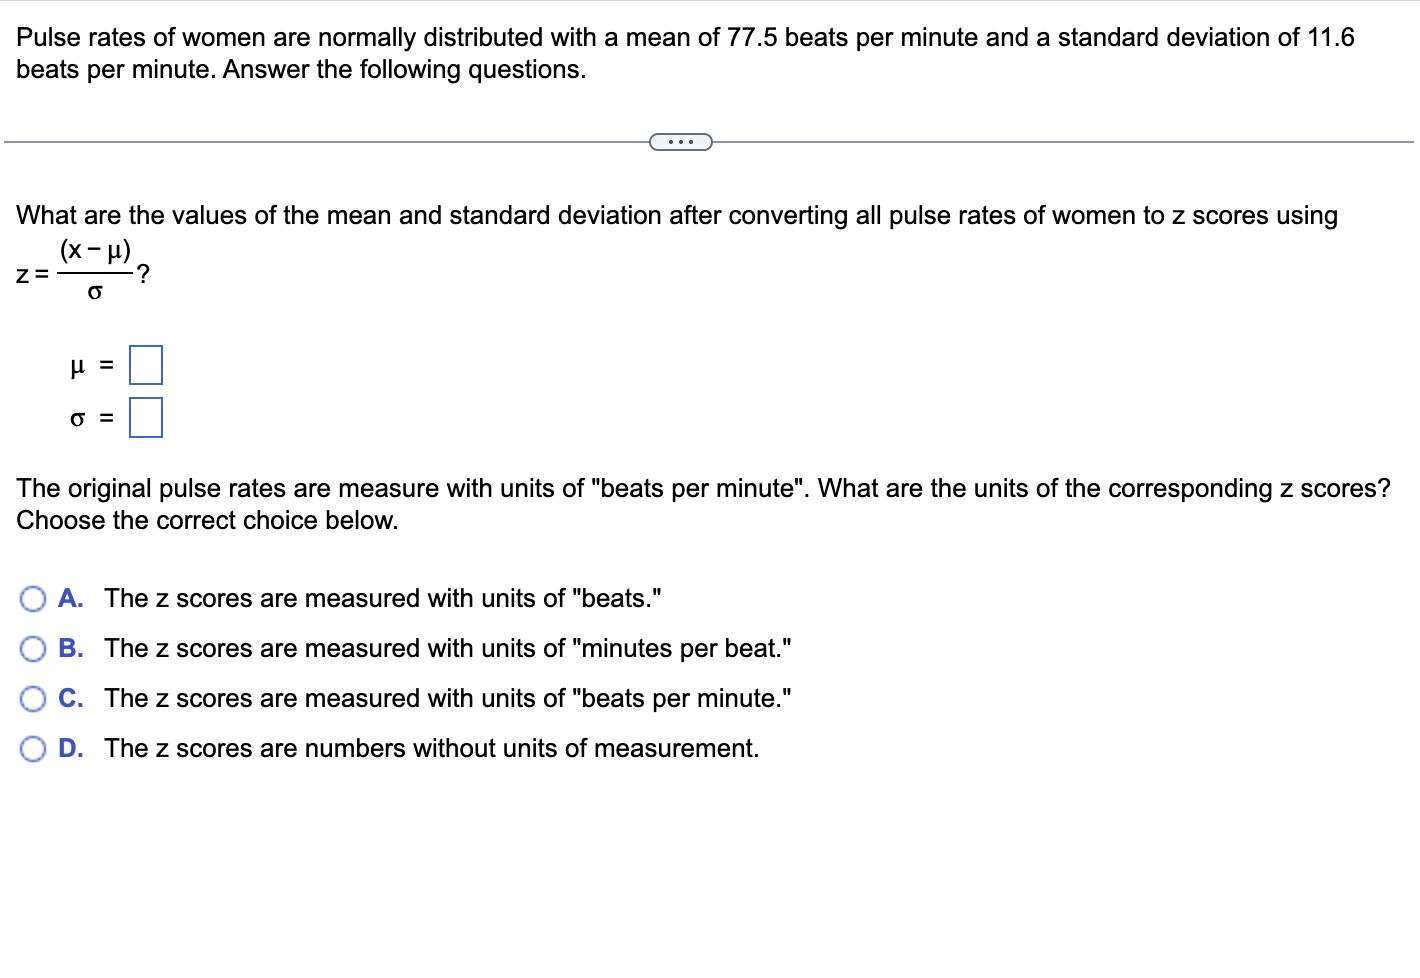
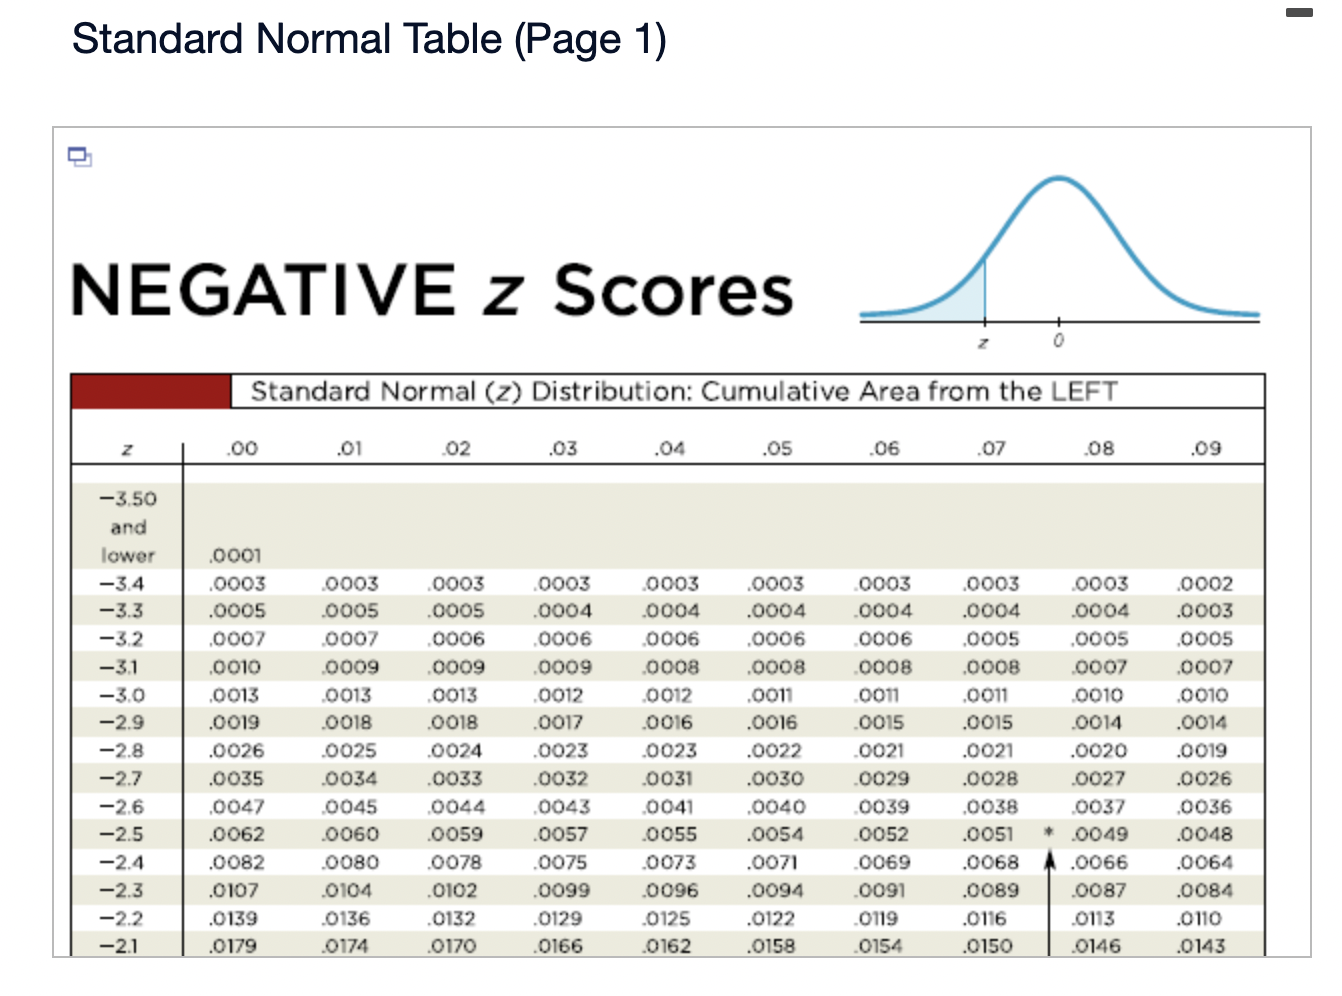
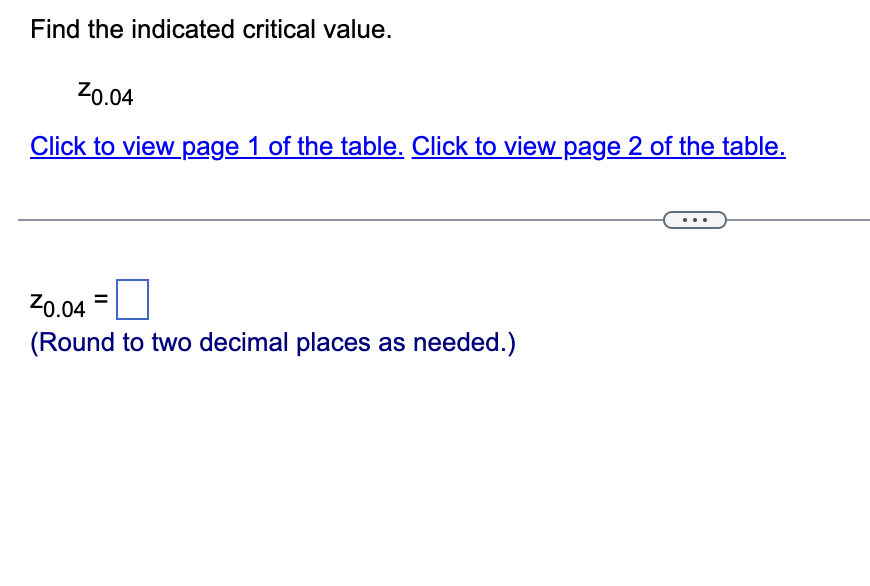
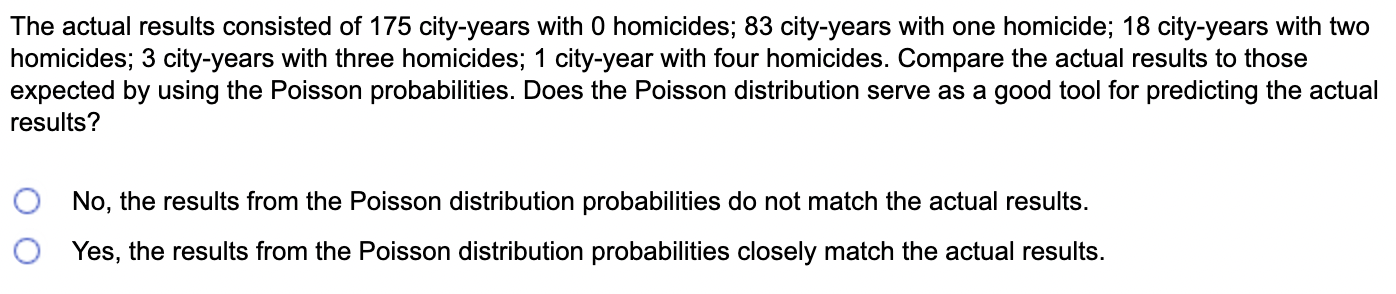
In a recent year, a hospital had 4226 births. Find the mean number of births per day, then use that result and the Poisson distribution to nd the probability that in a day, there are 14 births. Does it appear likely that on any given day, there will be exactly 14 births? The mean number of births per day is D. (Round to one decimal place as needed.) The probability that, in a day, there are 14 births is D. (Round to three decimal places as needed.) It is El for a day to have exactly 14 births because the probability is 'j relatively close to 1. relatively close to 0. less than 0.5. greater than 0.5. Data from 14 cities were combined for a 20year period, and the 280 cityyears included a total of 132 homicides. After finding the mean number of homicides per city-year, find the probability that a randomly selected city-year has the following numbers of homicides. Then compare the actual results to those expected by using the Poisson probabilities. Homicides each a. 0 b. 1 c. 2 d. 3 e. 4 CI city-year Actual results 175 83 18 3 1 (E a. P(0) = D (Round to four decimal places as needed.) b. P(1)=D (Round to four decimal places as needed.) 0. P(2) = D (Round to four decimal places as needed.) d. P(3)=D (Round to four decimal places as needed.) e. P(4) = D (Round to four decimal places as needed.) A normal distribution is informally described as a probability distribution that is "bell-shaped" when graphed. Draw a rough sketch of a curve having the bell shape that is characteristic of a normal distribution. Choose the correct answer below. -:j j:- A. (j :3 B. cj j) C. -:j j:- D. A? 1133A: L ,o Standard Normal Table (Page 1) NEGATIVE 2 Scores Standard Normal (2) Distribution: Cumulative Area from the LEFT .00 .01 02 .03 .04 .05 .06 .07 .03 .09 3.50 and lower .0001 3 4 .0003 0003 0003 0003 0 003 .0003 0003 .0003 0003 .0002 3.3 .0005 .0005 .0005 .0004 .0004 .0004 .0004 .0004 .0004 .0003 3 2 .000} 000; 0006 0006 0006 .0006 0006 .0005 .0005 .0005 3.1 .0010 .0009 .0009 0009 .0008 .0008 0008 .0008 .0007 .0007 3 0 .0013 0013 0013 001? 001? .0011 0011 .0011 0010 .0010 2.9 .0019 .0018 .0018 .00111 .0016 .0016 .0015 .0015 .0014 .0014 2.8 .0026 .0025 .0024 .0023 .0 023 .0022 0021 .0021 .0020 .0019 2.7 .0035 .0034 .0033 .0032 .0031 .0030 .0029 .0028 .0027 .0026 2 6 .004; 0045 0044 0043 0041 .0040 0039 .0058 003.? .0036 2.5 .0062 .0060 .0059 .0057 .0055 .0054 .0052 .0051 * .0049 .0048 2.4 .0082 .0080 .0078 .0075 .0 073 .0071 0069 .0068 .0066 .0064 2.3 .0107 .0104 .0102 .0099 .0096 .0094 .0091 .0089 .0087 .0084 2.2 .0139 .0136 .013? .0129 .0125 .012? 0119 .0116 .0113 .0110 2.1 .0179 .0174 .0170 .0166 .0162 .0158 .0154 .0150 .0146 .0143 Standard Normal Table (Page 2) POSITIVE 2 Scores Standard Normal (2) Distribution: Cumulative Area from the LEFT .00 .01 .02 .03 .04 .05 .06 .07 .08 .09 0.0 .5000 5040 5080 .5120 .5160 .5199 .5239 5279 .5319 .5359 0.1 .5398 .5438 .5478 .5517 .5557 .5596 .5636 .5675 .5714 .5753 0.2 5 793 .5632 5671 5910 5946 596 7 .6026 6064 .6103 .6141 0.3 .6179 .6217 .6255 .6293 .6331 .6368 .6406 .6443 6480 .6517 0.4 6554 6591 .6628 6664 6700 6736 .6772 .6806 6844 6879 0.5 .6915 6950 .6985 .7019 .7054 .7088 .7123 7157 .7190 .7224 0.6 7757 7291 7324 7357 7369 74?? .7454 7466 .7517 .7549 0.7 .7580 .7611 .7642 .7673 .7704 .7734 .7764 .7794 .7823 .7852 0.6 78-81 7910 793 9 7967 7995 602.5 .6051 8076 .6106 .6153 0.9 .8159 .8186 .8212 .8238 .8284 .8289 .8315 .8340 .8365 .8389 1.0 .8413 8438 8461 .8485 .8508 .8531 .8554 .8577 .8599 .8621 1.1 .8643 8665 8686 .8708 .8729 .8749 .8770 .8 790 .8810 .8830 1.2 6649 8669 8686 6907 6975 8944 .8967 .6980 .6997 9015 1.3 .9032 .9049 .9066 .9082 .9099 .9115 .9131 .9147 .9162 .9177 1.4 .9192 9207 9222 .9236 .9251 .9265 .9279 9292 9306 .9319 1.5 .9332 .9345 .9357 .9370 .9382 .9394 .9406 .9418 .9429 .9441 1.6 9452 9463 9474 9484 9495 ' 9505 .9515 9525 .9535 9545 Find the area of the shaded region. The graph depicts the standard normal distribution with mean 0 and standard deviation 1. Click to View Large 1 of the table. Click to View p_age 2 of the table. 2: 0.47 The area of the shaded region is D. (Round to four decimal places as needed.) Standard Normal Table (Page 1) NEGATIVE 2 Scores N (:1 Standard Normal (2) Distribution: Cumulative Area from the LEFT .00 .01 02 .03 .04 .05 .06 .07 .0 B .09 "3.50 and lower .0001 3 4 .0003 .0003 0003 0003 0 003 .0003 0003 .0003 0003 .0002 -3.3 .0005 .0005 .0005 .0004 .0004 .0004 .0004 .0004 .0004 .0003 $ 2 .000} 000! 0006 0006 0006 .0006 0006 .0005 .0005 .0005 ~31 .0010 .0009 .0009 .0009 .0008 .0008 0008 .0008 .0007 .0007 3 0 .0013 .0013 0013 0012 0012 .0011 0011 .0011 0010 .0010 \"2.9 .0019 .0018 .0018 .001? .0016 .0016 .0015 .0015 .0014 .0014 2.8 .0026 .0025 .0024 .0023 .0023 .002? 0021 .0021 .00?!) .0019 "2.7 0035 .0034 .0033 .0032 .0031 .0030 .0029 .0028 .0027 .0026 -2 6 .004} 0045 00-44 00-43 0041 .0040 0039 .0038 003} .0036 2.5 .0062 .0060 .0059 .0057 .0055 .0054 .0052 .0051 * .0049 .0048 2.4 .0082 .0080 003'8 .0075 .0 073 .0071 0069 .0068 .0066 .0064 \"2.3 .010? .0104 .0102 .0099 .0096 .0094 .0091 .0089 .0087 .0084 -2.2 .0139 .0136 .0132 .0129 .0125 .012? 0119 .0116 .0113 .0110 2.1 .0179 .0174 .0170 .0166 .0162 .0158 .0154 .0150 .0146 .0143 Standard Normal Table (Page 2) POSITIVE 2 Scores Standard Normal (2) Distribution: Cumulative Area from the LEFT .00 .01 .02 .03 .04 .05 .06 .07 .08 .09 0.0 .5000 5040 5080 .5120 .5160 .5199 .5239 5279 .5319 .5359 0.1 .5398 .5436 .5476 .5517 .5557 .5596 .5636 .5675 .5714 .5753 0.2 5 793 .5832 5671 5910 5948 598 7 .6026 6064 .6105 .6141 0.3 .6179 .6217 .6255 .6293 .6331 .6368 .6406 .6443 6480 .6517 0.4 6554 6591 .6628 6664 6700 6736 .6772 .6808 6844 6879 0.5 .6915 6950 .6985 .7019 .7054 .7088 .7123 7157 .7190 .7224 0.6 7257 7291 7324 7357 7389 742? .7454 7436 .7517 .7549 0. 7 .7580 .7611 .764 2 .76 73 .7704 .7734 .7764 7 794 7623 .7652 0.5 78-81 7910 7939 7967 .7995 802.5 .8051 90 78 .8106 .8153 0.9 .8159 .8186 .8212 .8238 .8264 .8289 .8315 .8340 .9365 .8389 1.0 .8413 843 B 8461 .8485 .8508 .8531 .8554 .8577 .8599 .6621 1.1 .6643 8665 3686 .8708 .8729 .8749 .8770 .8 790 .8810 .8830 1.? 8349 6369 3688 390 7 6925 9944 .8962 .8930 .9997 9015 1.3 .9032 .9049 .9066 .9082 .9099 .9115 .9131 .9147 .9162 .9177 1.4 .9192 9207 9222 .9236 .9251 .9265 .9279 9292 9306 .9319 1.5 .9332 .9345 .9357 .9370 .9382 .9394 .9406 .9418 .9429 .9441 1.6 9452 9463 9474 9484 .9495 ' 9505 .9515 9525 .9535 .9545 Find the indicated z score. The graph depicts the standard normal distribution with mean 0 and standard deviation 1. 0. 1922 0 Z The indicated z score is. (Round to two decimal places as needed.)Assume that adults have IQ scores that are normally distributed with a mean of u = 100 and a standard deviation o = 20. Find the probability that a randomly selected adult has an IQ less than 124. Click to view page 1 of the table. Click to view page 2 of the table. . . . The probability that a randomly selected adult has an IQ less than 124 is (Type an integer or decimal rounded to four decimal places as needed.)Standard Normal Table (Page 1) NEGATIVE 2 Scores -3.50 and iowor 3 4 -3.3 5 2 -5'1 5 0 -2.9 ?.3 -2.7 2 6 -2.5 2.4 -2.3 ?.2' -2.! f) Standard Normal (2) Distribution: Cumulative Area from the LEFT .00 .0001 .0003 .0005 .000 f .0010 .0013 .0019 .0096 .0035 .001: I .0062 .0082 .0107 .0139 .0179 .01 0003 .0005 000! .0009 .0013 .0018 .0075 .0034 .0045 .0060 .0030 .0104 .0136 .0174 02 0003 .0005 0006 .0009 0013 .0018 .0074 .0033 00:4 .0059 .0078 .0102 .013? .0170 .03 0003 .0004 0006 .0009 001? .0017 .00?3 .0032 00:5 .0057 .0075 .0099 .0179 .0166 .04 0 003 .0004 0 006 .0008 0 01? .0016 .0 093 .0031 0 041 .0055 .0 073 .0096 .01?5 .0162 .05 .0003 .0004 .0006 .0008 .0011 .0016 .0011? .0030 .004 0 .0054 .0071 .0094 .012? .0158 .06 0003 .0004 000 6 0003 0011 .0015 00:31 .0029 0039 .0052 0069 .0091 0119 .0154 .07 .0003 .0004 .0005 .0008 .0011 .0015 .0091 .0028 .0038 .0051 .0068 .0089 .0116 .0150 .03 0003 .0004 .0005 .0007 .0010 .0014 .0070 .0027 .00311 .0049 .0066 .0087 .0113 .0146 .09 .0002 .0003 .0005 .0007 .0010 .0014 .0019 .0026 .0056 .0043 .0064 .0084 .0110 .0143 \\l Standard Normal Table (Page 2) POSITIVE z Scores Standard Normal (z) Distribution: Cumulative Area from the LEFT .00 .01 .02 .03 .04 .05 .06 07 .08 09 0.0 5000 5040 5080 .5120 .5160 .5199 .5239 5279 .5319 .5359 0,1 .5398 5438 .5478 .5517 .5557 .5596 .5636 .5675 5714 .5753 0.2 .5793 5832 5871 .5910 .5948 .5987 6026 6064 6103 .6141 0.3 .6179 .6217 .6255 6293 .6331 .6368 .6406 .6443 6480 .6517 0.4 6554 6591 6628 6664 6700 6736 .6772 .6808 6844 .6879 0.5 6915 6950 6985 7019 7054 7088 .7123 7157 .7190 .7224 0.6 .7257 .7291 .7324 7357 .7389 .7422 .7454 .7486 .7517 .7549 0.7 .7580 .7611 .7642 .7673 .7704 .7734 .7764 .7794 .7823 .7852 0.8 .7881 7910 7939 .7967 .7995 8023 .8051 8078 .8106 .8133 0.9 .8159 8186 .8212 8238 8264 8289 .8315 .8340 .8365 8389 1.0 .8413 8438 8461 8485 .8508 .8531 .8554 .8577 .8599 .8621 1.1 .8643 8665 8686 8708 8729 8749 .8770 8790 .8810 .8830 1.2 8849 8869 8888 8907 8925 8944 .8962 8980 8997 .9015 1.3 .9032 .9049 .9066 .9082 .9099 .9115 .9131 .9147 .9162 .9177 1.4 .9192 9207 9222 9236 .9251 9265 .9279 9292 .9306 .9319 1.5 .9332 9345 9357 9370 9382 .9394 .9406 9418 .9429 .9441 1.6 9452 9463 9474 9484 9495 .9505 .9515 9525 .9535 9545Pulse rates of women are normally distributed with a mean of 77.5 beats per minute and a standard deviation of 11.6 beats per minute. Answer the following questions. E) What are the values of the mean and standard deviation after converting all pulse rates of women to z scores using (x - ll) z= ? The original pulse rates are measure with units of "beats per minute". What are the units of the corresponding 2 scores? Choose the correct choice below. The z scores are measured with units of "beats." The z scores are measured with units of "minutes per beat." The 2 scores are measured with units of "beats per minute." 9.0!\"? The z scores are numbers without units of measurement. Find the indicated IQ score. The graph to the right depicts IQ scores of adults, and those scores are normally distributed with a mean of 100 and a standard deviation of 15. Click to view [393 1 of the table. Click to View [age 2 of the table. 0.9? The indicated IQ score, x, is D. (Round to one decimal place as needed.) Standard Normal Table (Page 1) NEGATIVE z Scores Standard Normal (z) Distribution: Cumulative Area from the LEFT .01 .02 .03 04 05 .06 .07 08 .09 -3.50 and lower .0001 -3.4 .0003 .0003 0003 .0003 .0003 .0003 .0003 .0003 .0003 .0002 -3.3 .0005 .0005 .0005 .0004 .0004 .0004 0004 .0004 .0004 .0003 -3.2 .0007 .0007 0006 0006 .0006 .0006 0006 .0005 .0005 .0005 -3.1 .0010 .0009 .0009 .0009 .0008 .0008 .0008 .0008 .0007 .0007 -3.0 .0013 .0013 .0013 .0012 .0012 .0011 0011 .0011 .0010 .0010 -2.9 .0019 .0018 .0018 .0017 0016 .0016 0015 .0015 0014 .0014 -2.8 .0026 .0025 .0024 .0023 .0023 .0022 0021 .0021 .0020 .0019 -2.7 .0035 0034 .0033 .0032 .0031 .0030 .0029 .0028 .0027 .0026 -2.6 .0047 .0045 .0044 .0043 .0041 .0040 0039 .0038 0037 .0036 -2.5 .0062 0060 .0059 .0057 .0055 .0054 .0052 .0051 .0049 .0048 -2.4 .0082 .0080 .0078 .0075 .0073 .0071 .0069 .0068 .0066 .0064 -2.3 .0107 .0104 .0102 .0099 .0096 .0094 .0091 .0089 0087 .0084 -2.2 .0139 .0136 .0132 .0129 .0125 .0122 0119 .0116 .0113 .0110 -2.1 .0179 0174 .0170 .0166 .0162 .0158 .0154 .0150 0146 .0143\fThe random variable x represents the number of phone calls an author receives in a day, and it has a Poisson distribution with a mean of 7.3 calls. What are the possible values of x? Is a value of x = 2.9 possible? is x a discrete random variable or a continuous random variable? What are the possible values of x? {j} A. 0, 1, 2, 3, {1:} B. any real number greater than or equal to 0 and less than or equal to 7.3 (:1- C. any real number greater than or equal to 0 {:2 D. 1, 2, 3, Is a value of x = 2.9 possible? ls x a discrete random variable or a continuous random variable? A value of x = 2.9 El possible because x is a |:| random variable. Find the indicated critical value. Z0.04 Click to View {gage 1 of the table. Click to View {399 2 of the table. CE 20.04 = D (Round to two decimal places as needed.) The actual results consisted of 175 city-years with 0 homicides; 83 cityyears with one homicide; 18 cityyears with two homicides; 3 cityyears with three homicides; 1 cityyear with four homicides. Compare the actual results to those expected by using the Poisson probabilities. Does the Poisson distribution serve as a good tool for predicting the actual results? No, the results from the Poisson distribution probabilities do not match the actual results. Yes, the results from the Poisson distribution probabilities closely match the actual results
Step by Step Solution
There are 3 Steps involved in it
Step: 1
Get Instant Access to Expert-Tailored Solutions
See step-by-step solutions with expert insights and AI powered tools for academic success
Step: 2
Step: 3
Ace Your Homework with AI
Get the answers you need in no time with our AI-driven, step-by-step assistance