this is for stats: 1. A sociologist intends to estimate the percentage of adults who believe in astrology. How many adults does the sociologist need
this is for stats:
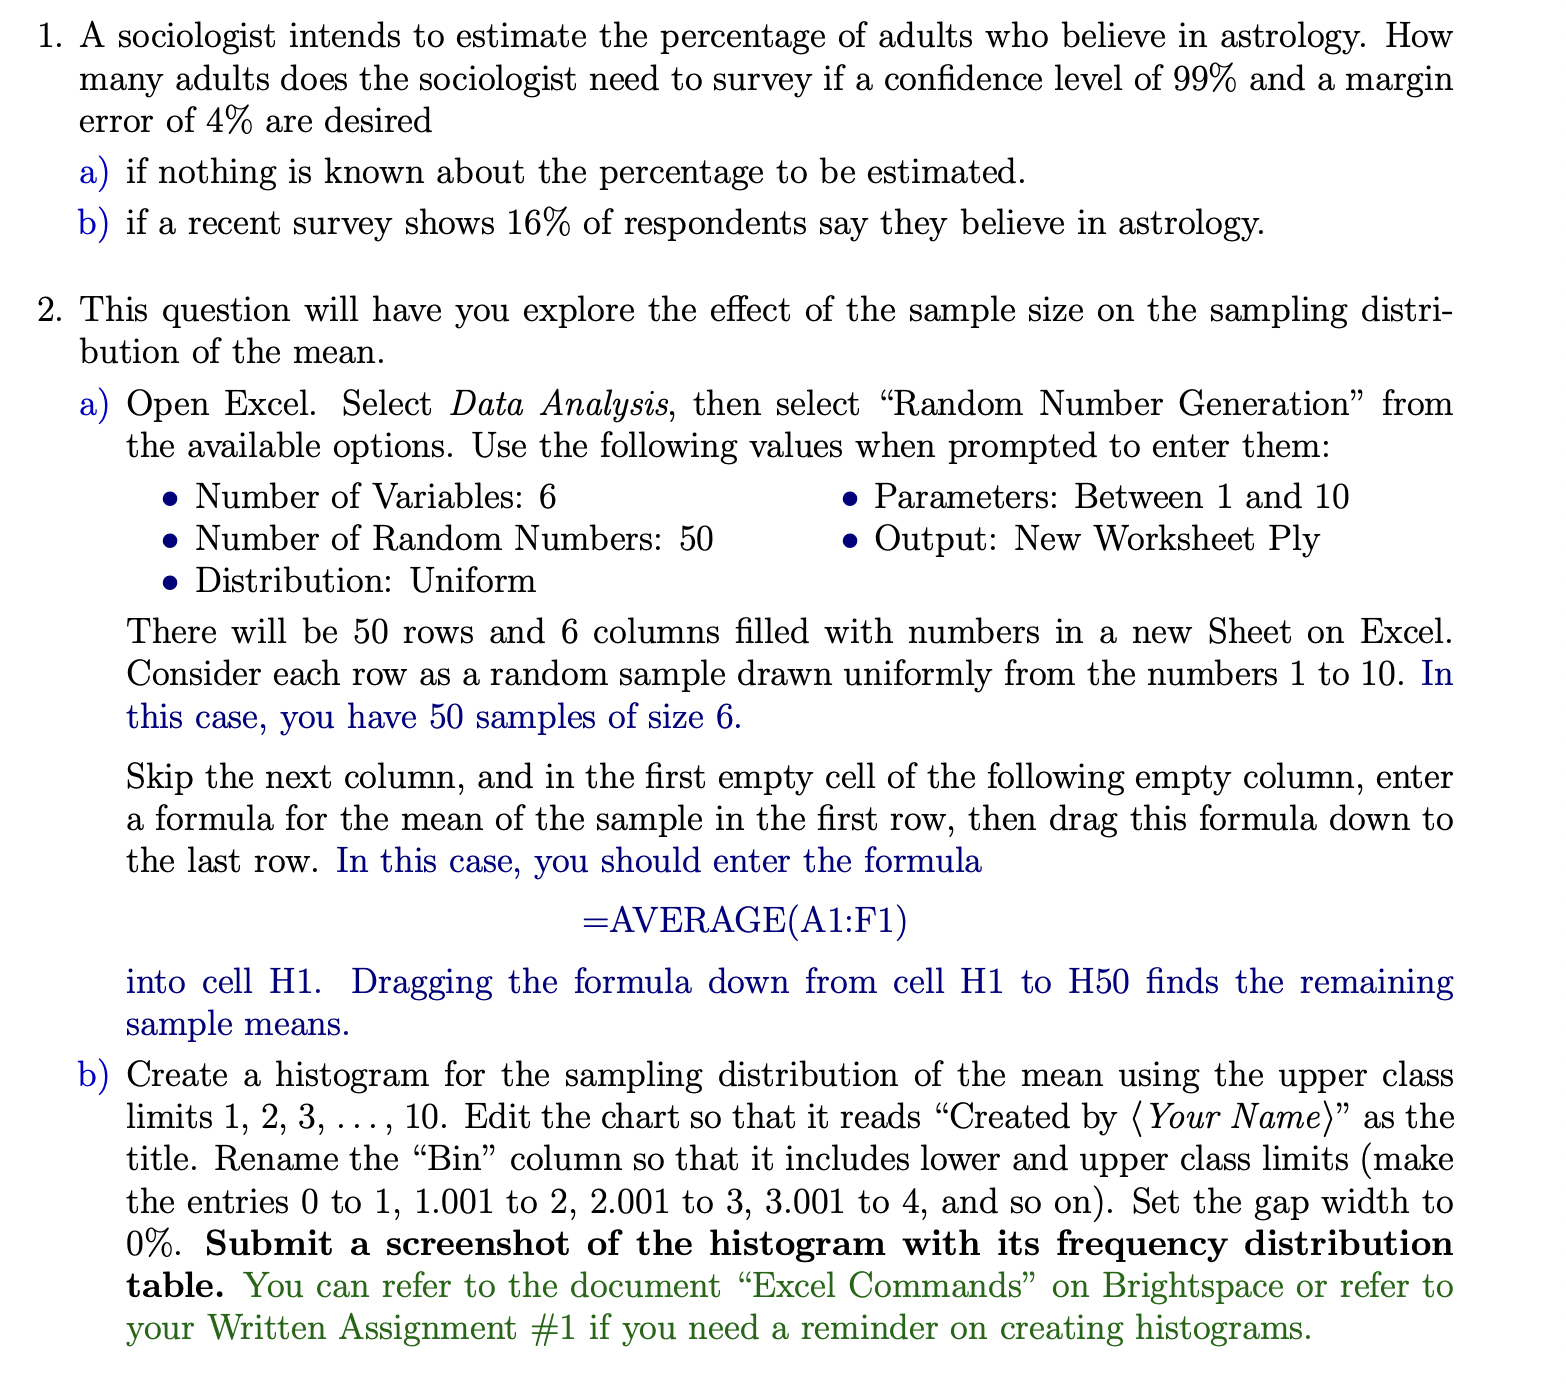
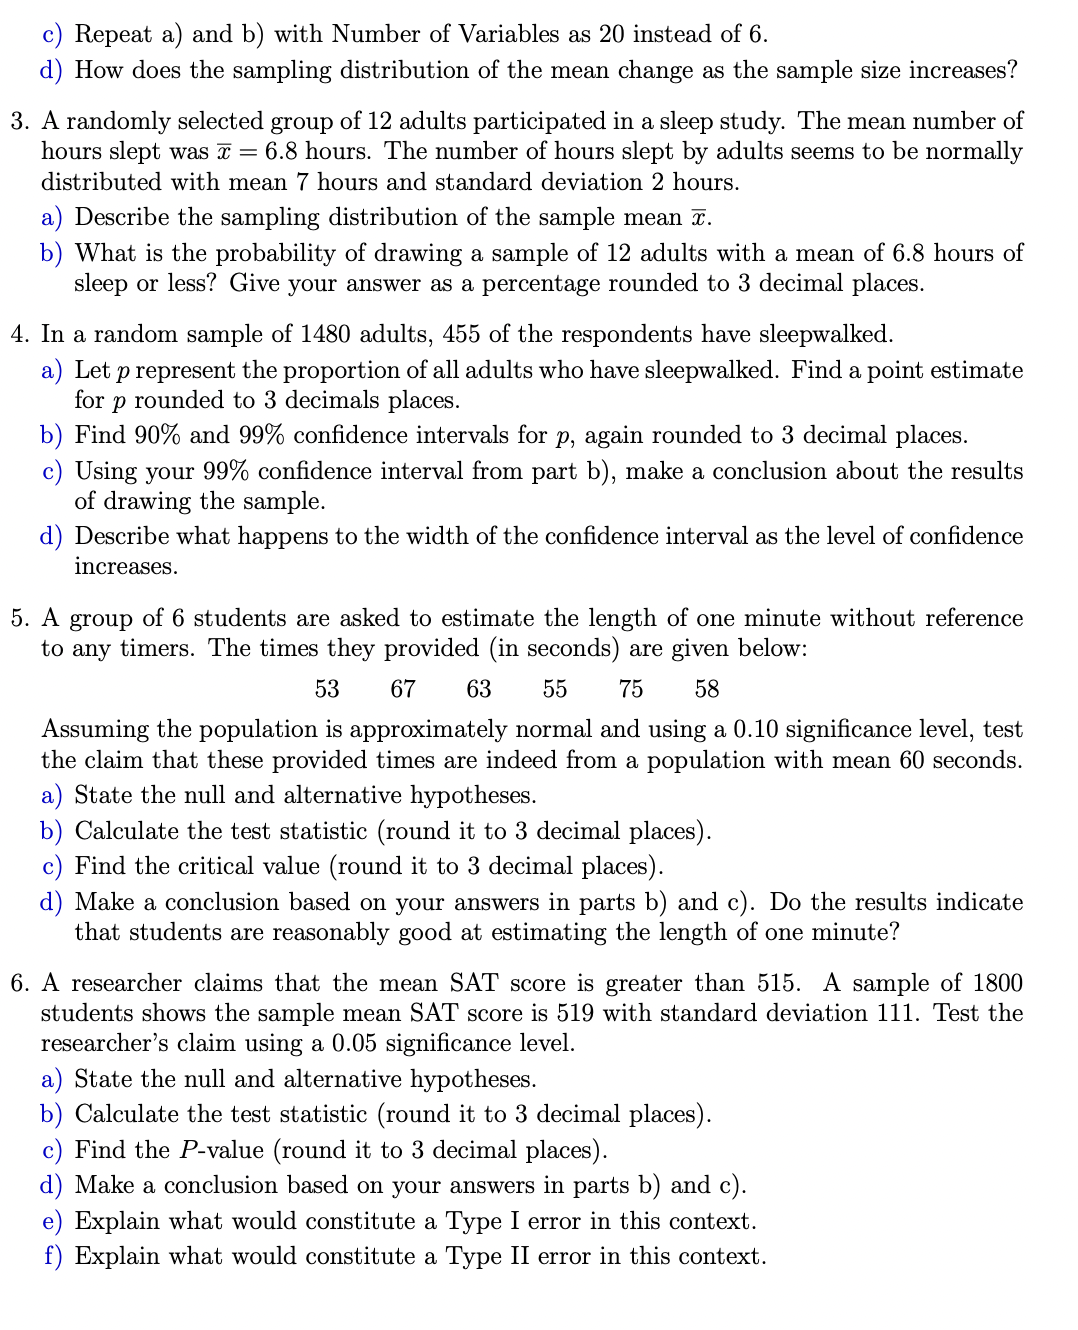
1. A sociologist intends to estimate the percentage of adults who believe in astrology. How many adults does the sociologist need to survey if a condence level of 99% and a margin error of 4% are desired a) if nothing is known about the percentage to be estimated. '0) if a recent survey shows 16% of respondents say they believe in astrology. 2. This question will have you explore the effect of the sample size on the sampling distri bution of the mean. a) Open Excel. Select Data Analysis, then select \"Random Number Generation\" from the available options. Use the following values when prompted to enter them: 0 Number of Variables: 6 0 Parameters: Between 1 and 10 0 Number of Random Numbers: 50 0 Output: New Worksheet Ply 0 Distribution: Uniform There will be 50 rows and 6 columns lled with numbers in a new Sheet on Excel. Consider each row as a random sample drawn uniformly from the numbers 1 to 10. In this case, you have 50 samples of size 6. Skip the next column, and in the rst empty cell of the following empty column, enter a formula for the mean of the sample in the rst row, then drag this formula down to the last row. In this case, you should enter the formula =AVERAGE(A1:F1) into cell H1. Dragging the formula down from cell H1 to H50 nds the remaining sample means. b) Create a histogram for the sampling distribution of the mean using the upper class limits 1, 2, 3, . . . , 10. Edit the chart so that it reads \"Created by (Your N ame)\" as the title. Rename the \"Bin\" column so that it includes lower and upper class limits (make the entries 0 to 1, 1.001 to 2, 2.001 to 3, 3.001 to 4, and so on). Set the gap width to 0%. Submit a screenshot of the histogram with its frequency distribution table. You can refer to the document \"Excel Commands\" on Brightspace or refer to your Written Assignment #1 if you need a reminder on creating histograms. 0) Repeat a) and b) with Number of Variables as 20 instead of 6. d) How does the sampling distribution of the mean change as the sample size increases? . A randomly selected group of 12 adults participated in a sleep study. The mean number of hours slept was E = 6.8 hours. The number of hours slept by adults seems to be normally distributed with mean 7 hours and standard deviation 2 hours. a) Describe the sampling distribution of the sample mean 5. b) What is the probability of drawing a sample of 12 adults with a mean of 6.8 hours of sleep or less? Give your answer as a percentage rounded to 3 decimal places. . In a random sample of 1480 adults, 455 of the respondents have sleepwalked. a) Let p represent the proportion of all adults who have sleepwalked. Find a point estimate for p rounded to 3 decimals places. b) Find 90% and 99% condence intervals for p, again rounded to 3 decimal places. c) Using your 99% condence interval from part b), make a conclusion about the results of drawing the sample. (:1) Describe what happens to the width of the condence interval as the level of condence increases. . A group of 6 students are asked to estimate the length of one minute without reference to any timers. The times they provided (in seconds) are given below: 53 67 63 55 75 58 Assuming the population is approximately normal and using a 0.10 signicance level, test the claim that these provided times are indeed from a population with mean 60 seconds. a) State the null and alternative hypotheses. b) Calculate the test statistic (round it to 3 decimal places). c) Find the critical value (round it to 3 decimal places). (1) Make a conclusion based on your answers in parts b) and c). Do the results indicate that students are reasonably good at estimating the length of one minute? . A researcher claims that the mean SAT score is greater than 515. A sample of 1800 students shows the sample mean SAT score is 519 with standard deviation 111. Test the researcher's claim using a 0.05 signicance level. a) State the null and alternative hypotheses. b) Calculate the test statistic (round it to 3 decimal places). 0) Find the Pvalue (round it to 3 decimal places). (1) Make a conclusion based on your answers in parts b) and c). e) Explain what would constitute a Type I error in this context. f) Explain what would constitute a Type 11 error in this context
Step by Step Solution
There are 3 Steps involved in it
Step: 1
Get Instant Access to Expert-Tailored Solutions
See step-by-step solutions with expert insights and AI powered tools for academic success
Step: 2
Step: 3
Ace Your Homework with AI
Get the answers you need in no time with our AI-driven, step-by-step assistance