This is Group Project F from Chapter 5 ofFundamentals of Differential Equations8th Edition R. Kent Nagle, Edward B. Saff, Arthur David Snider
Please answer (a) through (e)
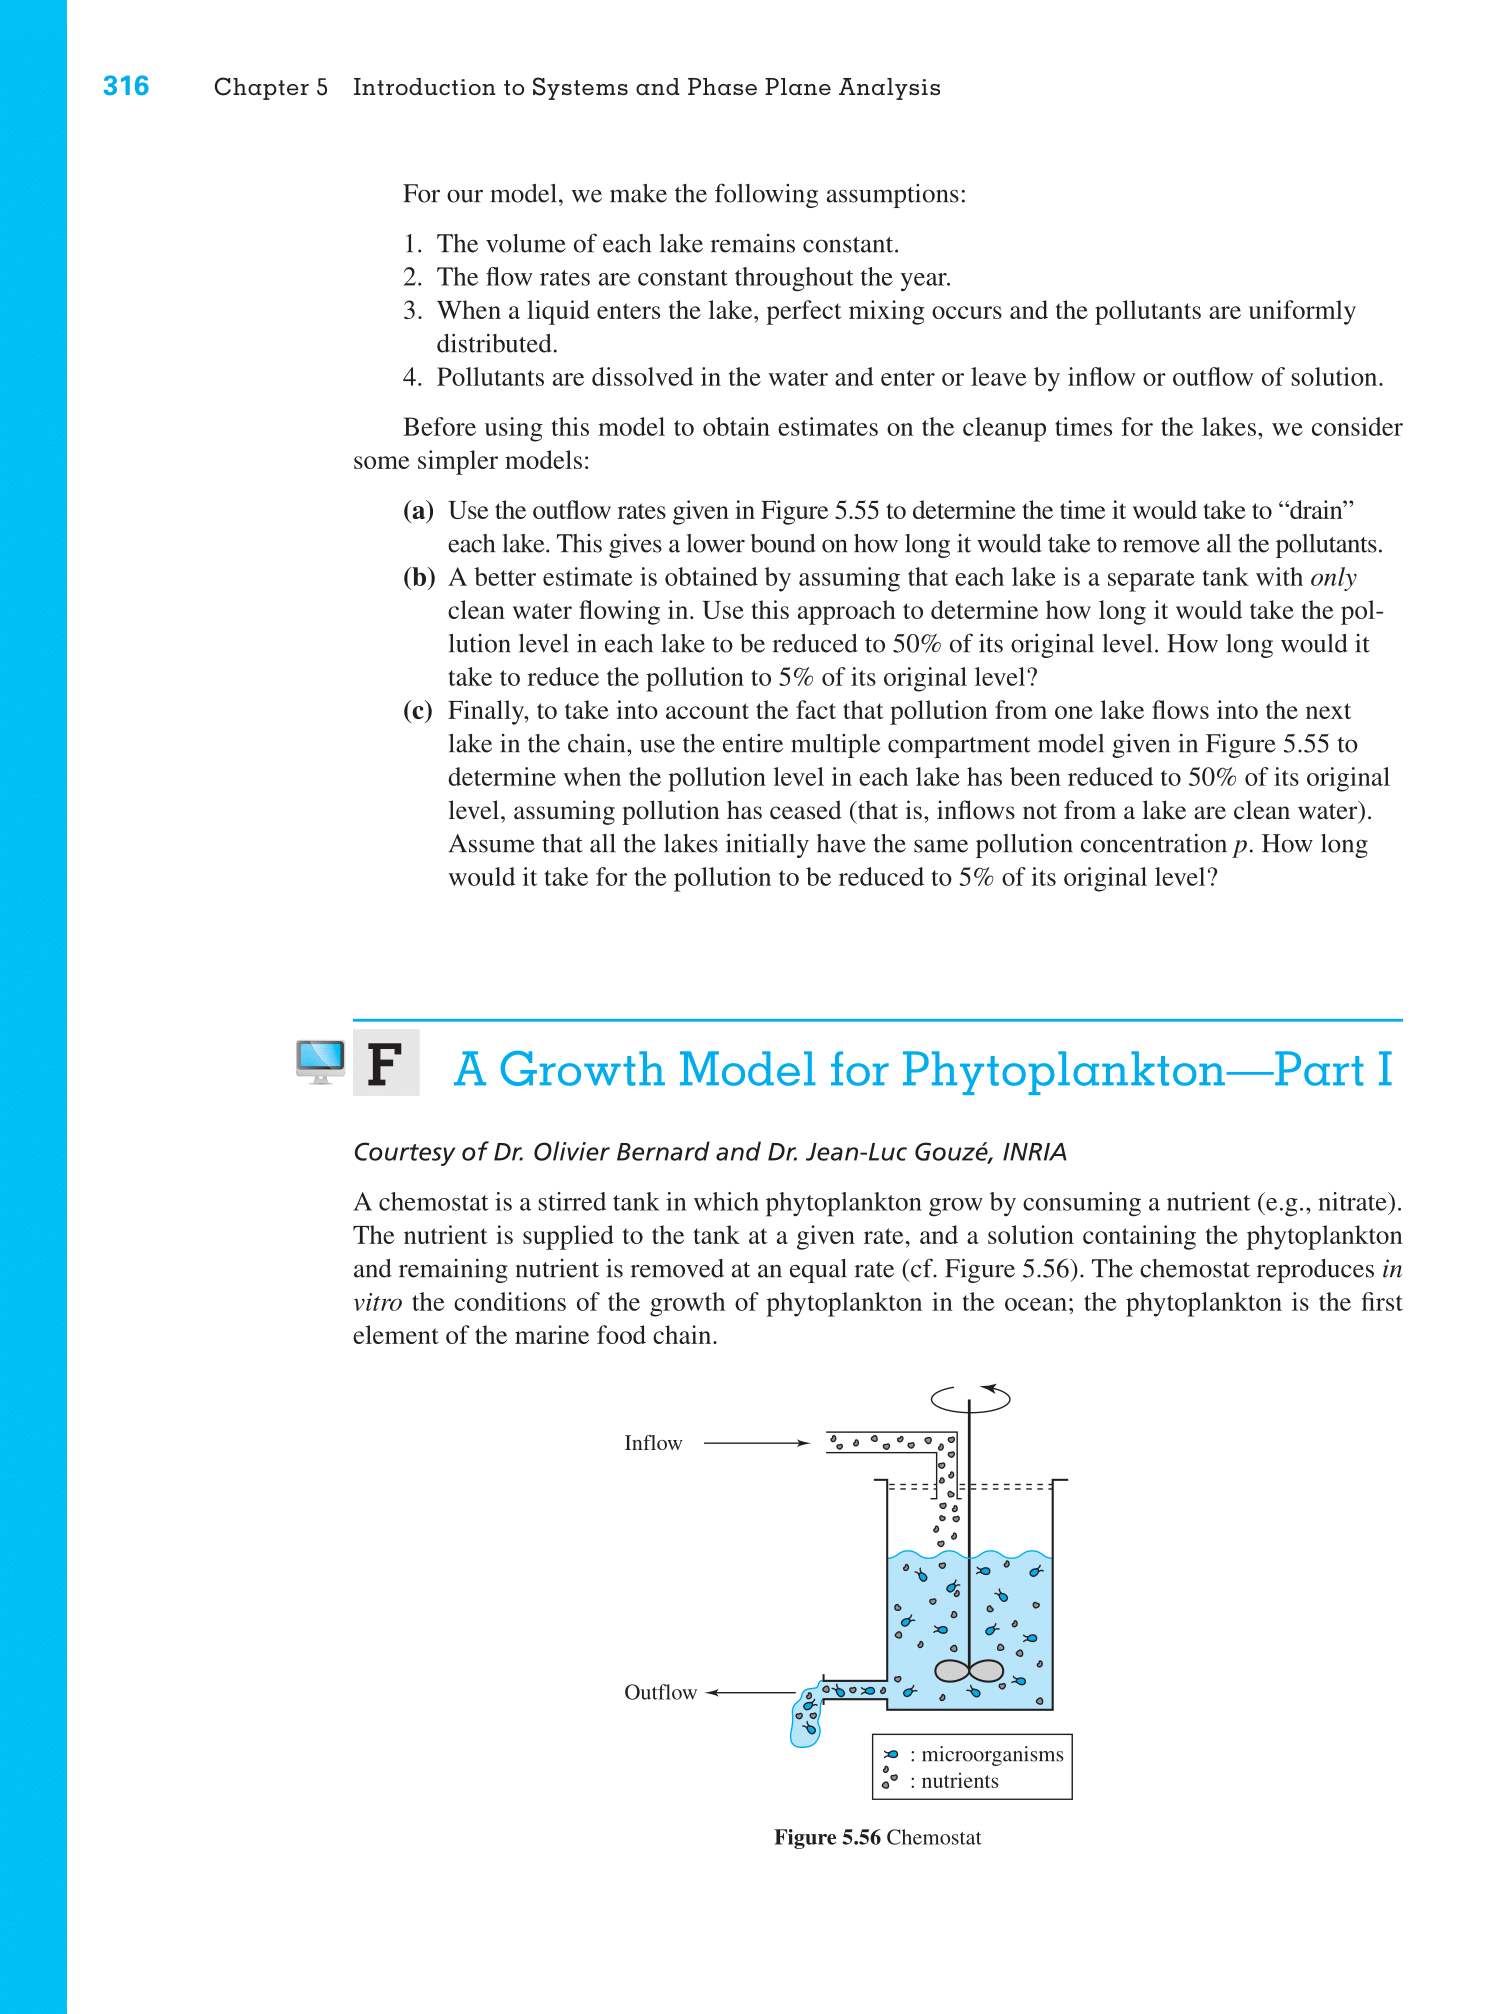
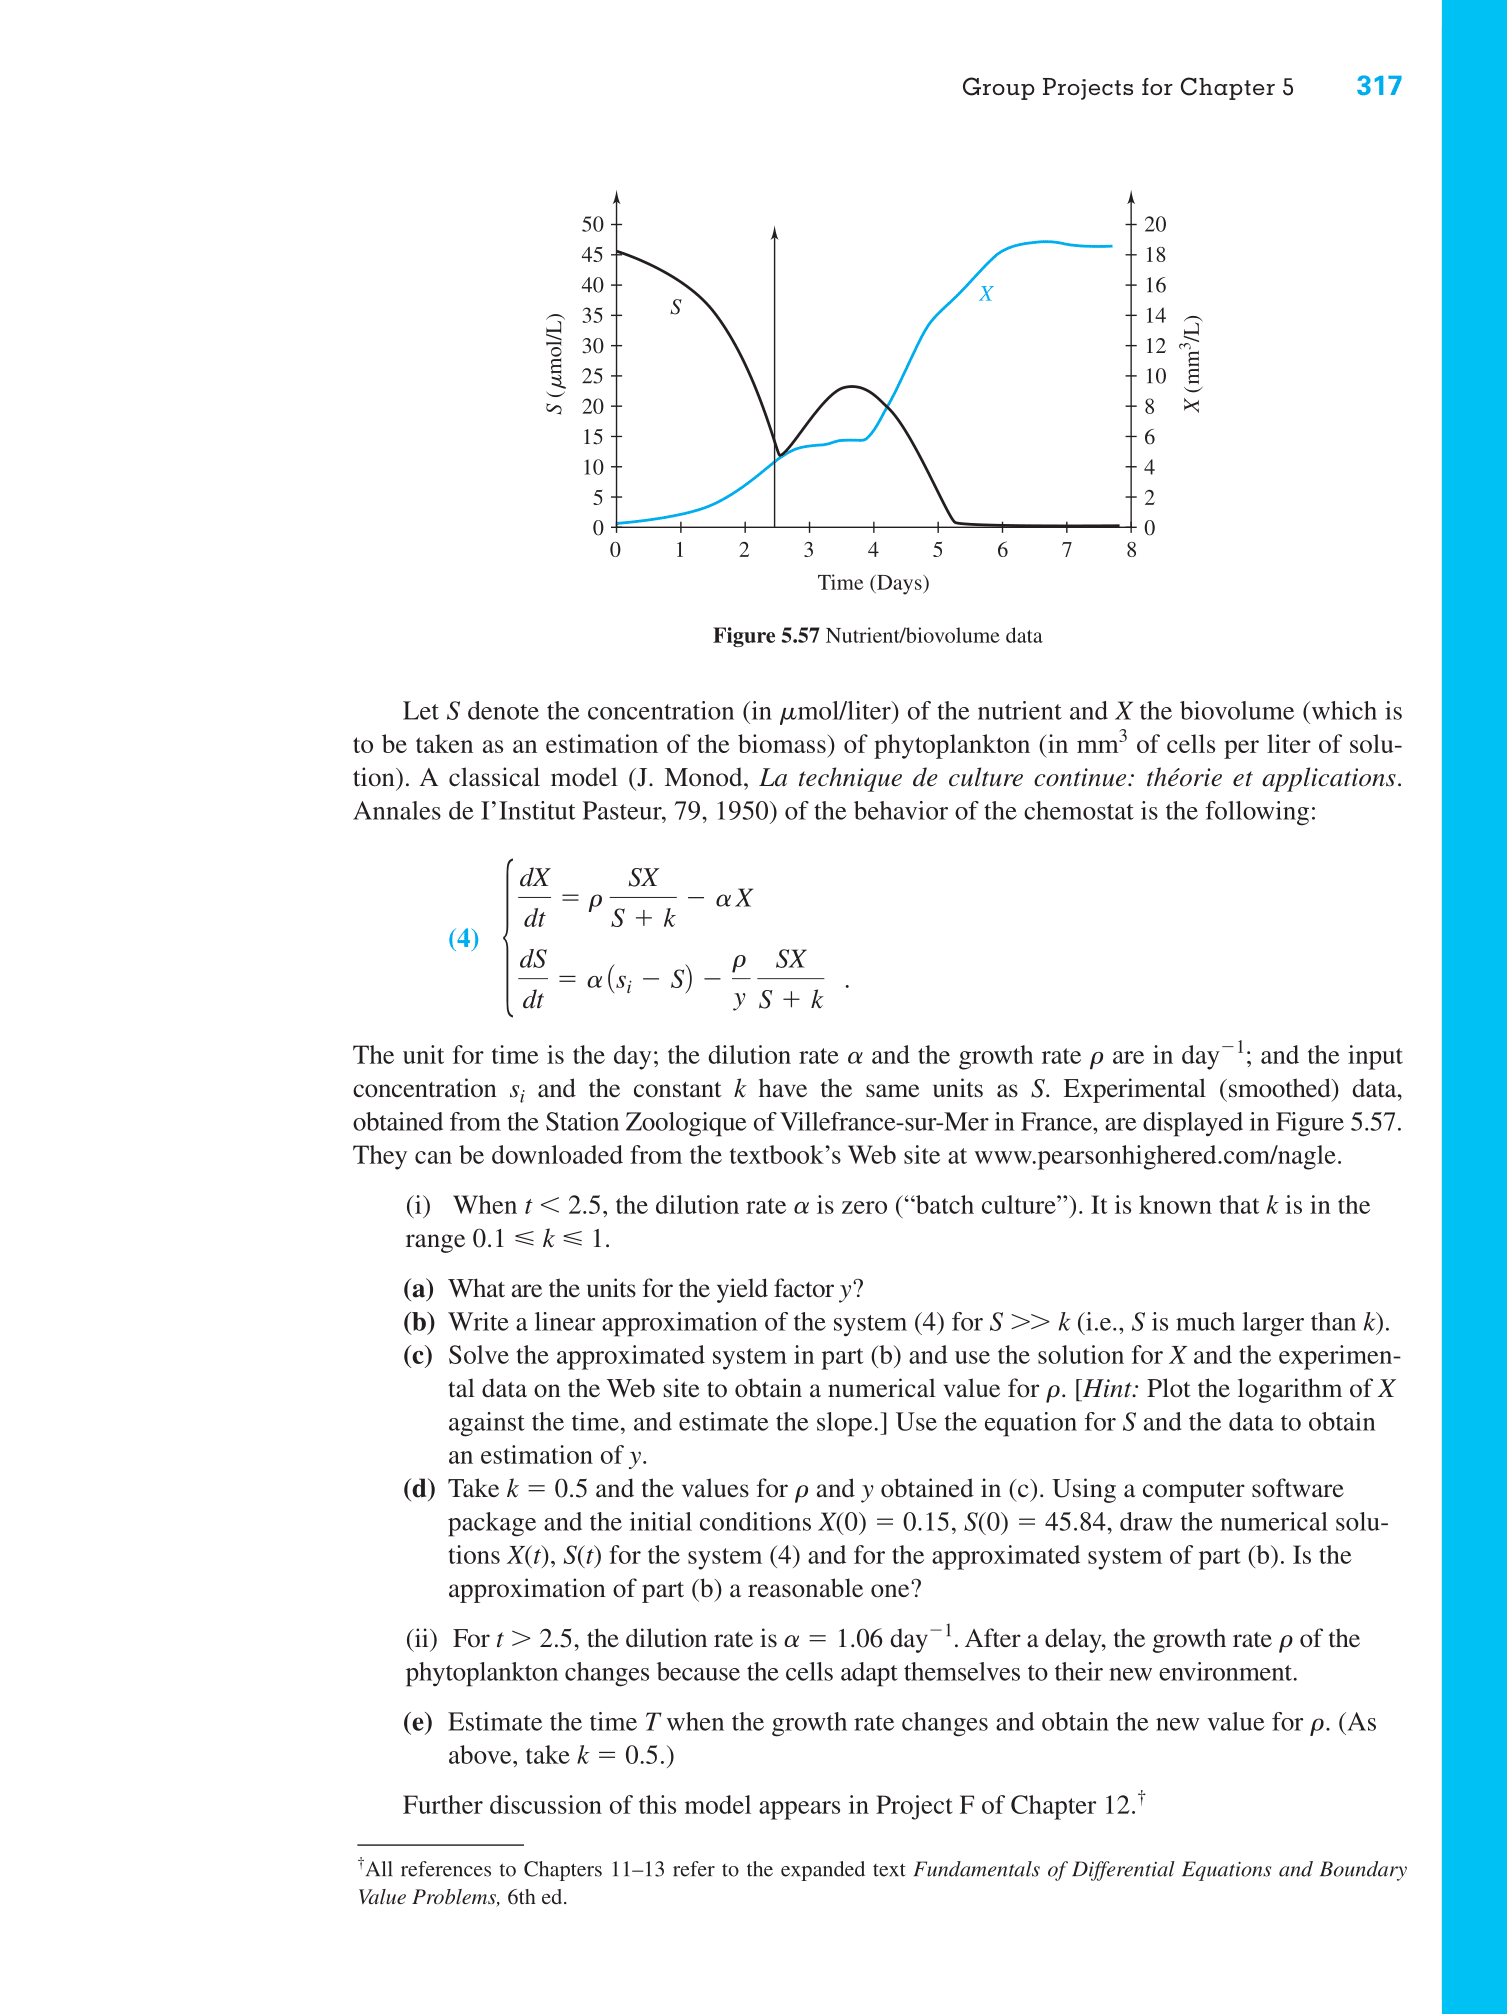
316 Chapter 5 Introduction to Systems cmd Phase Plane Analysis For our model, we make the following assumptions: 1. 2. 3. 4. The volume of each lake remains constant. The ow rates are constant throughout the year. When a liquid enters the lake, perfect mixing occurs and the pollutants are uniformly distributed. Pollutants are dissolved in the water and enter or leave by inow or outow of solution. Before using this model to obtain estimates on the cleanup times for the lakes, we consider some simpler models: (5:!) Use the outow rates given in Figure 5.55 to determine the time it would take to \"drain\" each lake. This gives a lower bound on how long it would take to remove all the pollutants. (b) A better estimate is obtained by assuming that each lake is a separate tank with only (C) clean water owing in. Use this approach to determine how long it would take the pol- lution level in each lake to be reduced to 50% of its original level. How long would it take to reduce the pollution to 5% of its original level? Finally, to take into account the fact that pollution from one lake ows into the next lake in the chain, use the entire multiple compartment model given in Figure 5.55 to determine when the pollution level in each lake has been reduced to 50% of its original level, assuming pollution has ceased (that is, inows not from a lake are clean water). Assume that all the lakes initially have the same pollution concentration p. How long would it take for the pollution to be reduced to 5% of its original level? E F A Growth Model for PhytoplanktonPart I Courtesy of Dr. Olivier Bernard and Dr. Jean-Lu: Gouz, INRIA A chemostat is a stirred tank in which phytoplankton grow by consuming a nutrient (e.g., nitrate). The nutrient is supplied to the tank at a given rate, and a solution containing the phytoplankton and remaining nutrient is removed at an equal rate (cf. Figure 5.56). The chemostat reproduces in vitro the conditions of the growth of phytoplankton in the ocean; the phytoplankton is the rst element of the marine food chain. Figure 5.56 Chemostat Group Projects for Chapter 5 317 S (,umollL) Time (Days) Figure 5.57 Nutrient/biovolume data Let S denote the concentration (in umol/liter) of the nutrient and X the biovolume (which is to be taken as an estimation of the biomass) of phytoplankton (in mm3 of cells per liter of solu- tion). A classical model (J. Monod, La technique dc culture continue: the'orie et applications. Annales de I'Institut Pasteur, 79, 1950) of the behavior of the chemostat is the following: dX SX =p aX dt S+k (4) d5 p SX =a(s,s). dt J'S-l-k The unit for time is the day; the dilution rate a and the growth rate p are in day1; and the input concentration s,- and the constant k have the same units as S. Experimental (smoothed) data, obtained from the Station Zoologique of Villefrance-sur-Mer in France, are displayed in Figure 5.57. They can be downloaded from the textbook's Web site at wwwpearsonhighered.comagle. (i) When I > k (i.e., S is much larger than k). (c) Solve the approximated system in part (b) and use the solution for X and the experimen- tal data on the Web site to obtain a numerical value for p. [Hint Plot the logarithm of X against the time, and estimate the slope] Use the equation for S and the data to obtain an estimation of y. (d) Take k = 0.5 and the values for p and y obtained in (c). Using a computer software package and the initial conditions X(0) = 0.15, 3(0) = 45.84, draw the numerical solu tions X(t), S(t) for the system (4) and for the approximated system of part (b). Is the approximation of part (b) a reasonable one? (ii) For t > 2.5, the diluan rate is a = 1.06 day\". After a delay, the growth rate p of the phytoplankton changes because the cells adapt themselves to their new environment. (e) Estimate the time Twhen the growth rate changes and obtain the new value for p. (As above, take k = 0.5.) Further discussion of this model appears in Project F of Chapter 12.1r lAll references to Chapters 1113 refer to the expanded text Fundamentals of Dieremial Equations and Boundary Value Problems, 6th ed